Collection Overview
The Collection Overview displays information about all of Flare's Dark Web and Illicit sources.
The Date Range filter allows you to choose over which period you want to view the data and charts. The filter at the top will apply to all the charts and tables. By default this filter will be set to the last 3 months.
Activity
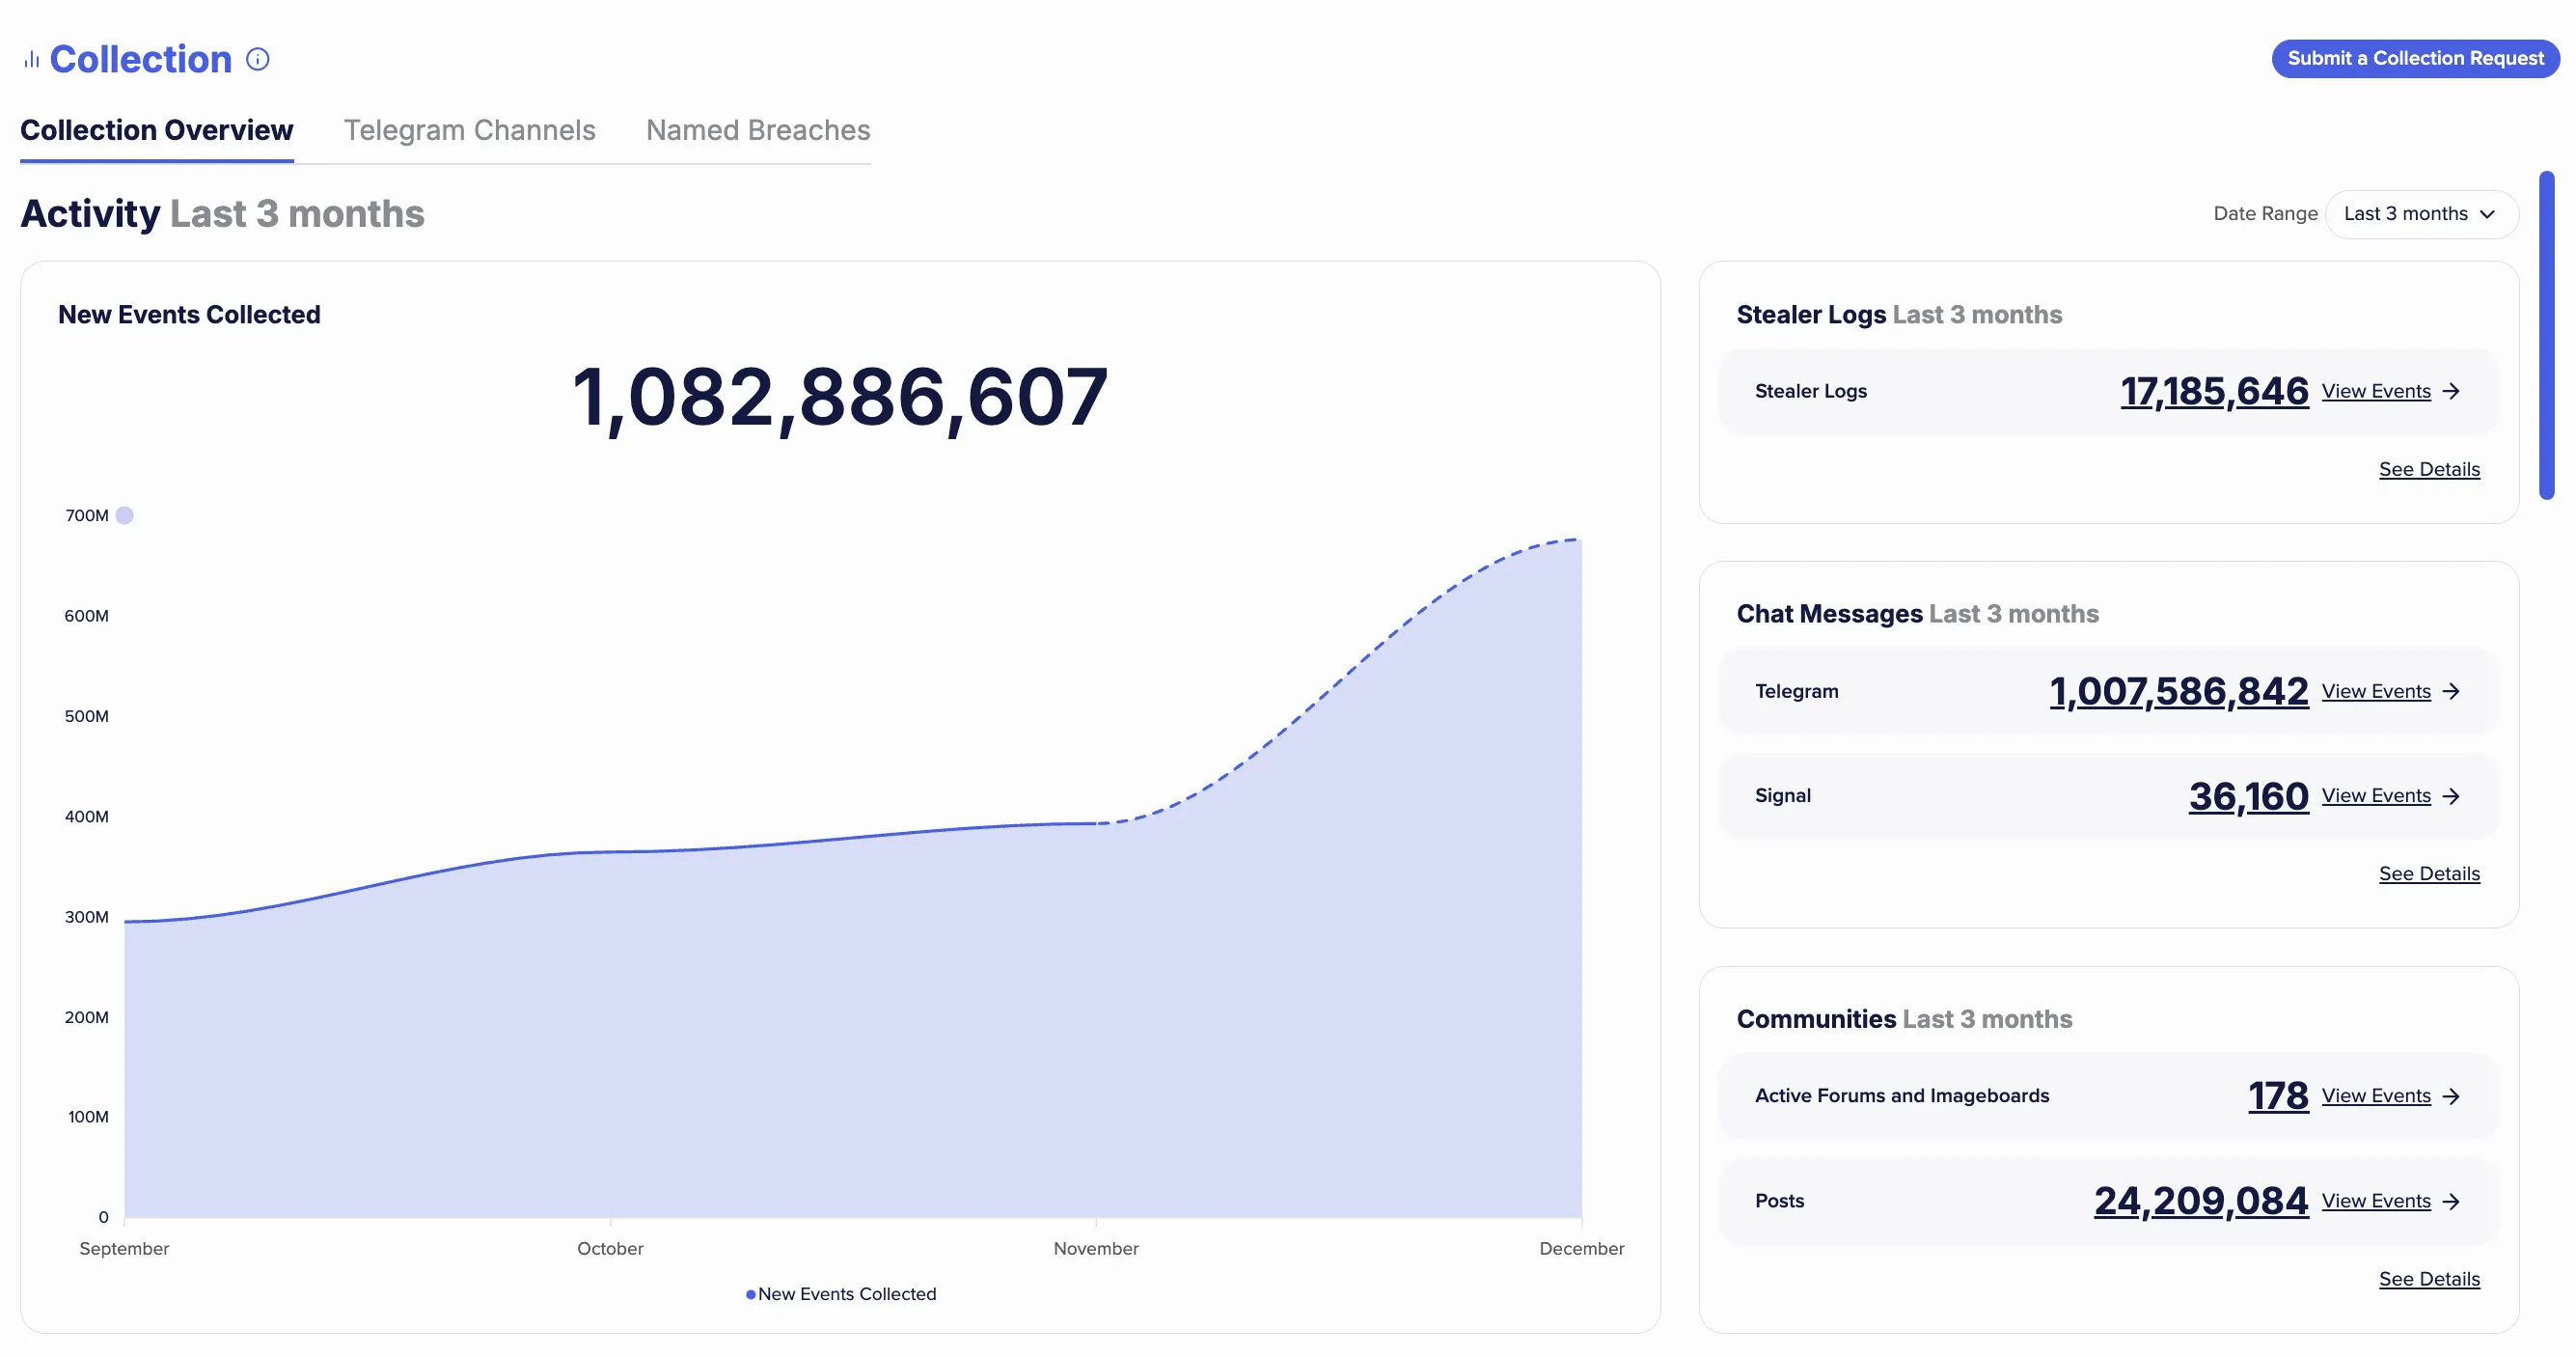
The Activity section gives you a high level view of the growth of Flare’s collection, focusing on our main illicit data gathering efforts; Leaked credentials, Stealer Logs, Chat Messages and Forums. The event counts will be based on the time range you have selected at the top of the page.
The See Details buttons expand to give you more information about a data category. Note the data in these panels is not live but rather periodically updated.
New Events Collected
This chart shows all the events collected by Flare from Dark Web and Illicit sources. You can hover your cursor over the line to get more details for a specific date. The last data point now shows a projected value based on how far we are into the month. Its line appears dotted, and the tooltip shows the real value while noting the projected one on the chart.
Stealer Logs
This chart shows all the stealer logs found by Flare. To dive deeper into how Flare’s stealer log log coverage has grown over time, and learn more about the malware infection families that Flare sees stealer logs from, you can click See Details.
Chat Messages
The Chat Messages section shows the counts of chat message events Flare has gathered from Telegram and Signal. To explore the details of our Telegram channel and message coverage, you can click See Details.
Communities
The Forums section shows the total count of active Forums and Imageboards Flare covers and the number of posts Flare has crawled from these Communities. To dive deeper into our Community coverage you can click See Details.
Source Status
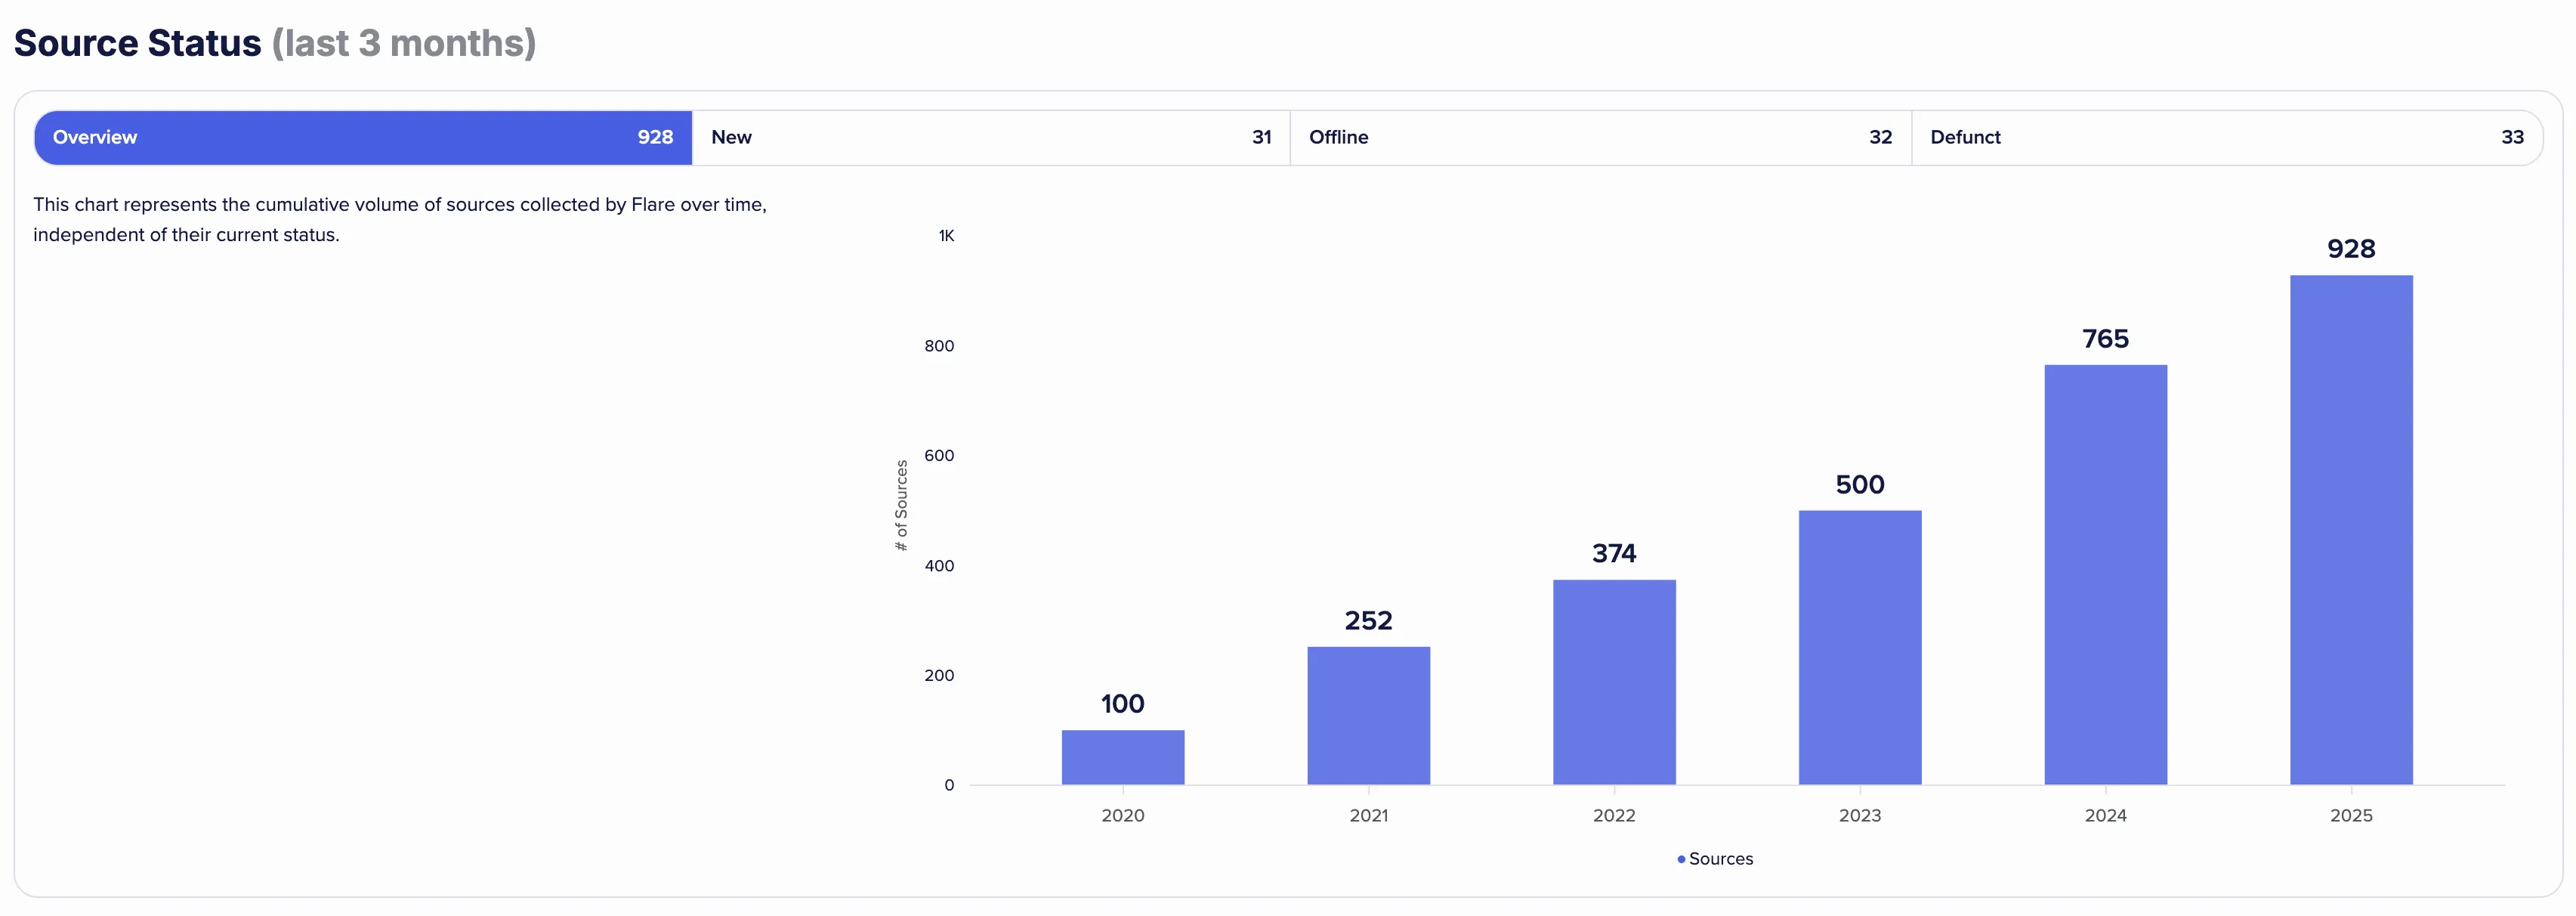
The Source Status section enables you to dive into how many Dark Web sources Flare gatherers data from, and the status of those sources. The data will be presented for the time frame you have selected at the top of the page.
Overview
The Overview tab gives you a high level overview and count of the Dark Web sources Flare gatherers data from.
New
The New tab will show you a table of all the sources Flare has started monitoring within the selected time range. If you click on the Global Events count you will be redirected to the Global Search events feed where you will be able to view all the events we have gathered for that source since we started monitoring it.
Offline
The Offline tab will show you a table of all the sources that were temporarily unavailable during the selected time range. The Status tag will inform you whether this source is still offline at the current time or if we have regained coverage. The Offline Date is the date that we lost coverage and the Recovered Date is the date that we regained coverage. Once coverage resumes, data collected during the offline period is typically recovered automatically where possible.
Defunct
The Defunct tab will show you a table of all the sources that we have stopped monitoring over the selected time range. We continue to make available all events we collected from a defunct source and if you click on the Archived Events count you will be redirected to the Global Search events feed where you will be able to view all the events we have gathered for that source.
A Defunct source refers to a source that Flare previously collected data from but is no longer accessible. For example, this could include a forum taken down by law enforcement that has not resurfaced after a reasonable period of time. This label is applied manually by our team after thorough checks confirm that the source is unlikely to return online.
Source Directory
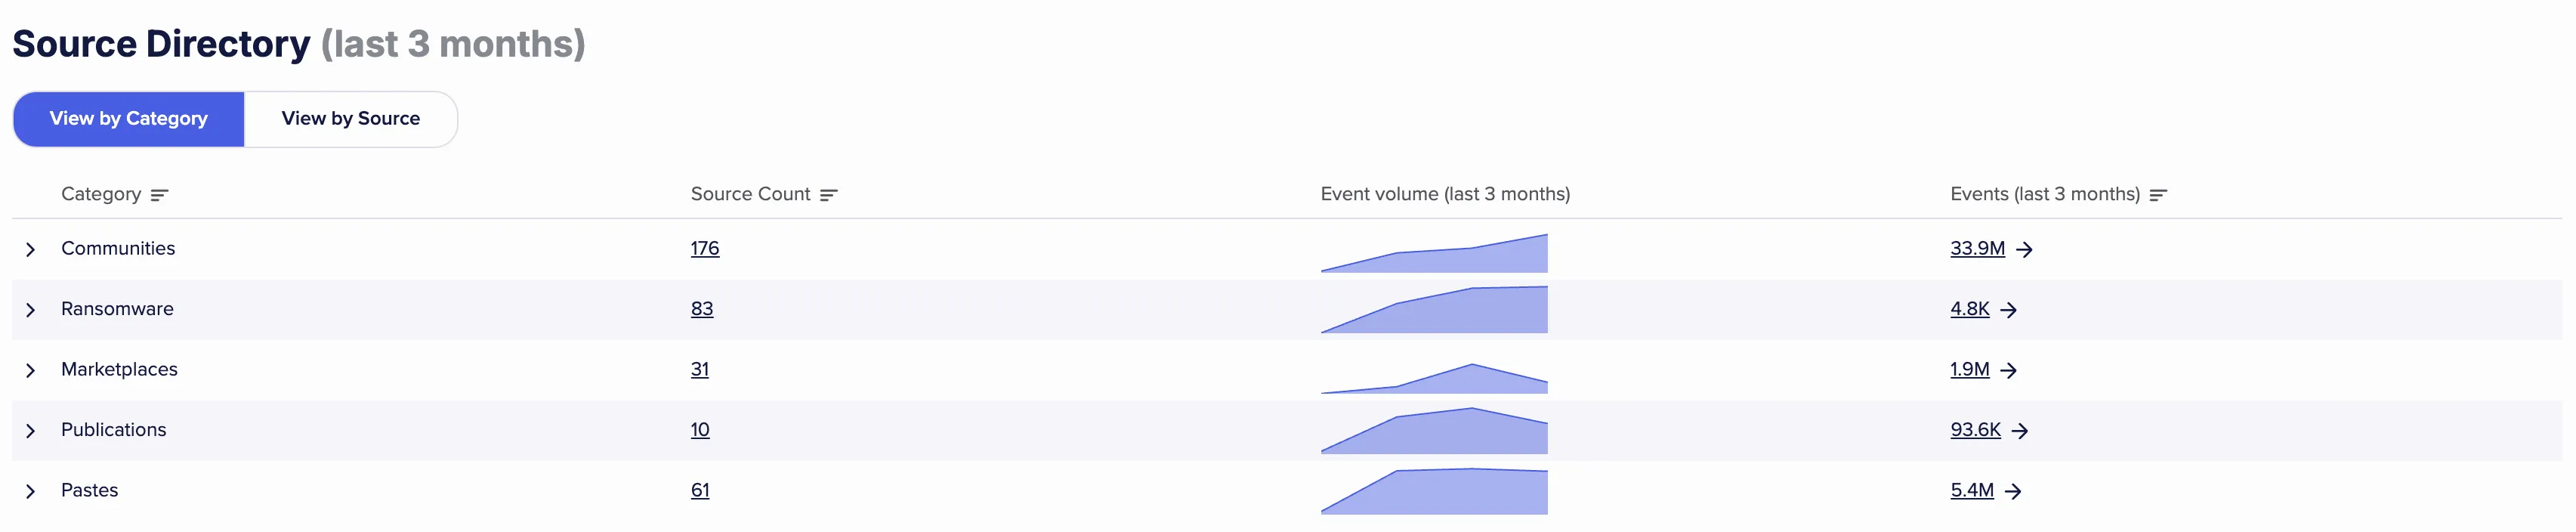
The Source Directory section is where you can dive into the details of each illicit data source Flare gathers data from. Clicking the chevron on the left of the row will open a section in the table with more information about the category or source. The event counts in these tables will be based on the time range you have selected at the top of the page.
View by Category
The View by Category tab allows you to view Flare’s Collection from a category perspective. The Source Count is the number of active sources within that category, and if you click this count you will be able to view all of those sources. If you click on the Global Events count you will be redirected to the Global Search events feed where you will be able to view all the events we have gathered for that category for the date range you have selected.
View by Source
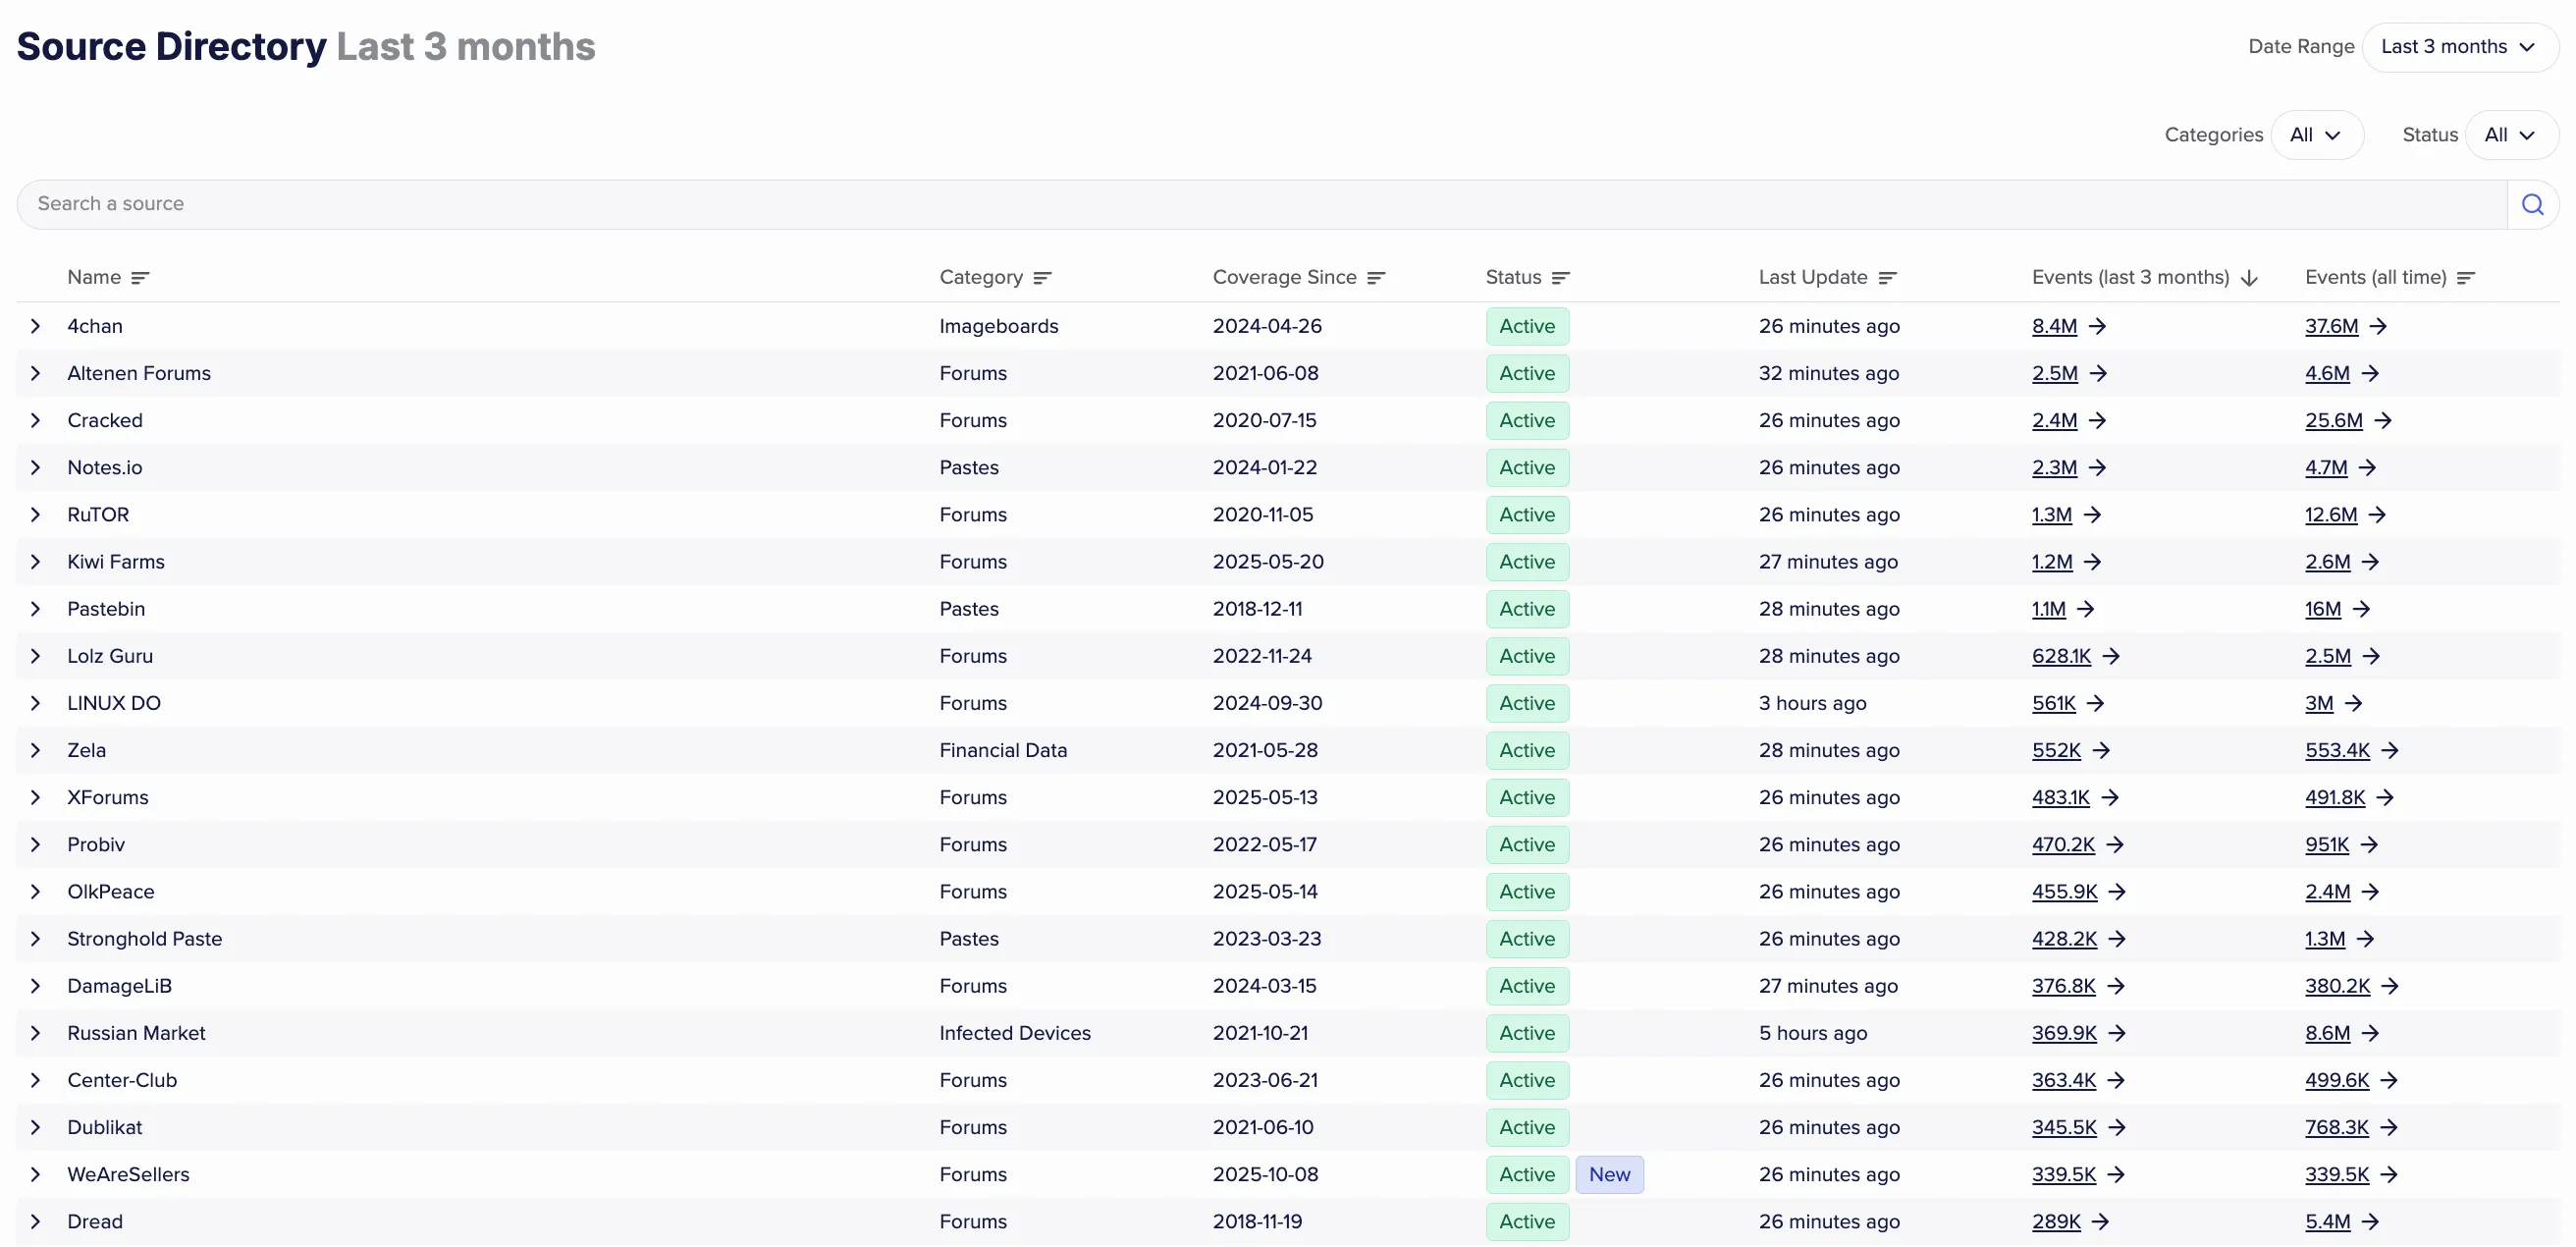
The View by Source tab allows you to view and search Flare’s Collection from a single Dark Web source perspective. You can filter this table by Category and by Status.
- New - We started monitoring this source within the last month.
- Active - Crawling is running as expected.
- Degraded - Crawling is running slower than expected, either because our systems are at capacity or the source has limits.
- It is important to note that when we return to Active coverage, data collected during the offline period is typically recovered automatically where possible.
- Offline - This source is temporarily unavailable and cannot be accessed by Flare.
- It is important to note that when we regain coverage, data collected during the offline period is typically recovered automatically where possible.
- Defunct - This source no longer exists, but Flare retains an archive of events collected from this source.
Crawling Frequency
Clicking the chevron on the left of the row will open a section in the table with more information about the source. The crawling frequency defines how often we intend to crawl a given source. This frequency varies from source to source and depends primarily on two factors: 1. How frequently new content is added, and 2. How valuable or relevant we believe the source is. If we do not crawl a source as often as its designated crawling frequency requires, the source will be marked as Degraded. It will remain in this status until we resume crawling it at the expected frequency.
These source-specific sections may also include detailed information about how that particular source is crawled. For example, they may explain if our coverage of the source is limited to certain sections or subsets of its content.