Sandbox
Sandbox and File Analysis is an isolated, in-platform environment for safely inspecting suspicious files and URLs. It is available as an add-on to the CTI Module.
When you submit a file or URL, it is analyzed inside a private virtual machine. Flare generates an analysis report covering execution behavior, process activity, file system changes, network activity, evasion techniques, extracted IOCs, and a MITRE ATT&CK mapping.
The Sandbox is powered by VMRay and uses hypervisor-based analysis.
Key Features
- In-platform virtual machine: Files and URLs are analyzed inside an isolated VM within Flare. No risk to corporate machines. No need to export files to an external service. The VM is spun up per submission and discarded after analysis.
- Automated analysis report: Each submission produces a structured report covering, execution behavior, process activity, file system changes, network activity (DNS requests, HTTP calls, C2 connections), evasion techniques attempted, and MITRE ATT&CK mapping of observed behaviors.
- IOC extraction: The analysis report automatically extracts network artifacts from the detonation: C2 domains, DNS requests, contacted URLs, and file hashes. These can be pushed into Feeds for distribution to your SIEM, EDR, or firewall — from sandbox submission to active blocking, without manual steps.
- Evasion-resistant analysis: VMRay's hypervisor sits beneath the operating system. The malware runs in an environment with, no monitoring hooks to detect, no agents inside the OS, no virtual machine fingerprints to identify. The malware cannot tell it is being analyzed, so it behaves naturally. This is why the Sandbox catches samples that hook-based alternatives miss.
- URL analysis: Complete behavioral analysis of URL submissions, covering phishing pages and credential harvesters with the same depth as file-based malware.
- Private by design: Submissions are not shared with the broader community, VMRay's research team, other Flare customers, any external partner. Results are visible only to the submitting Tenant.
Access to this feature requires an add-on. Please reach out to your CSM for more information.
Using the Sandbox
Click through the following product tour to learn how to use the Sandbox.
Submit a file or URL
- Navigate to the Sandbox page from the left navigation menu.
- Click Analyze File or URL, then upload a file or enter a URL to analyze.
- Enter a file name and provide a password if the file is password-protected.
Choose an analysis mode
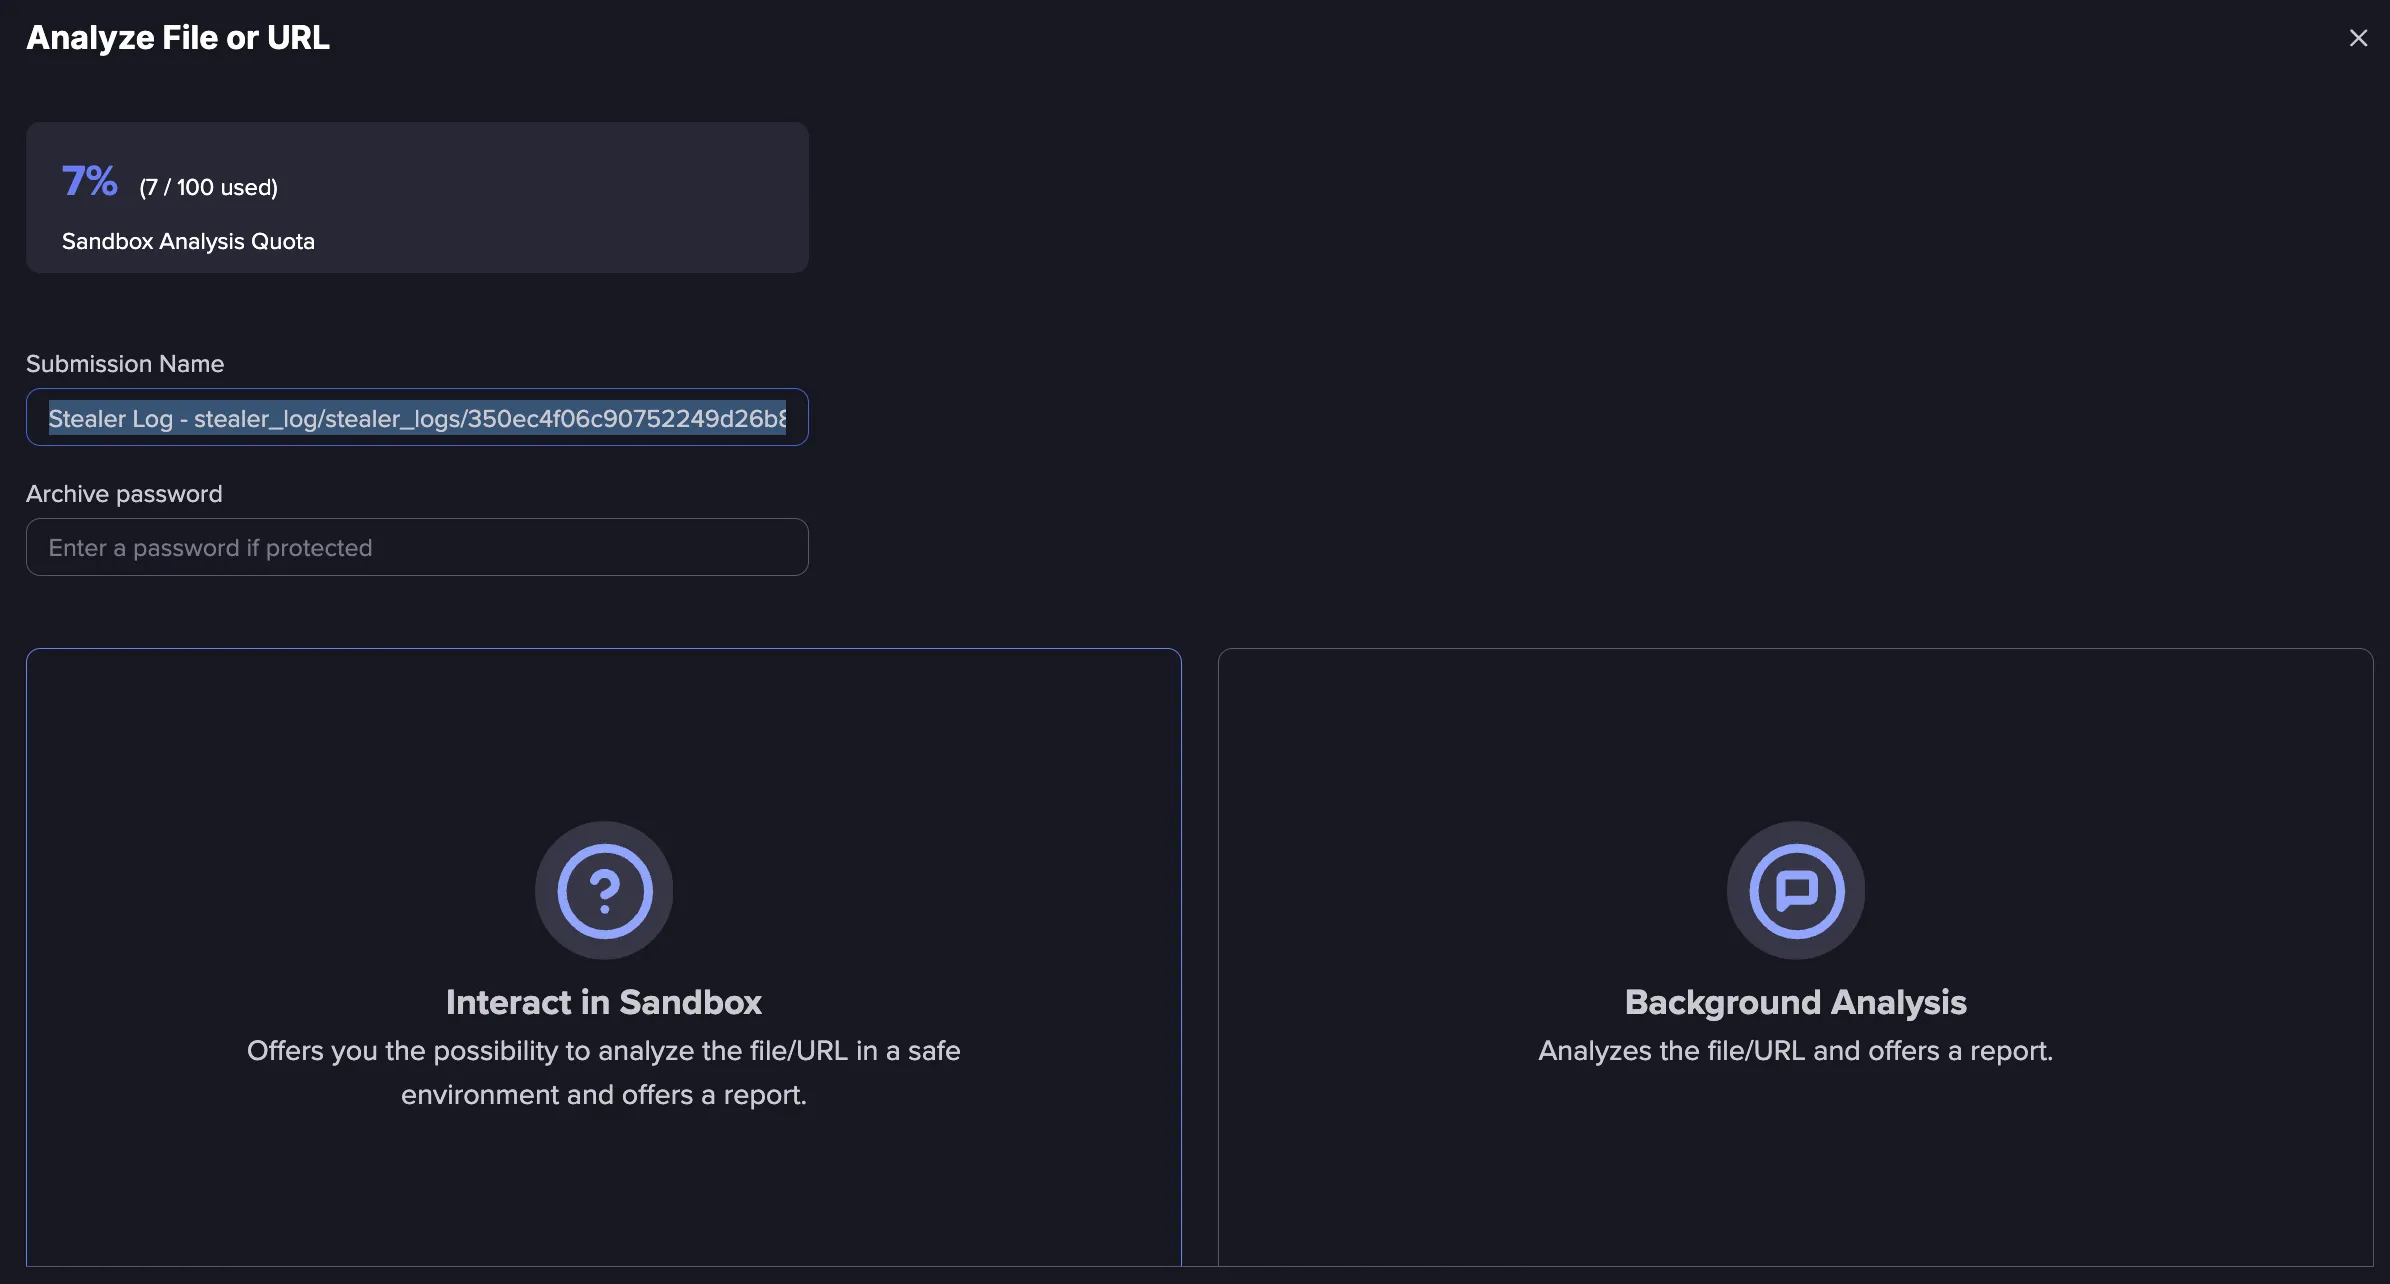
- Interactive analysis: Analyze the file or URL in a safe, isolated environment. This option boots up a virtual machine that can be interacted with directly, which is useful for evaluating the specific actions a file takes when executed. The virtual machine is permanently deleted after the session, so the file can be safely executed even if it performs malicious operations.
- Static analysis runs in the background and does not allow interaction with the file.
- The Sandbox does not currently support browsing onion links. By default, they are labeled as suspicious.
- The maximum supported file size is 680 MB.
Review the analysis report
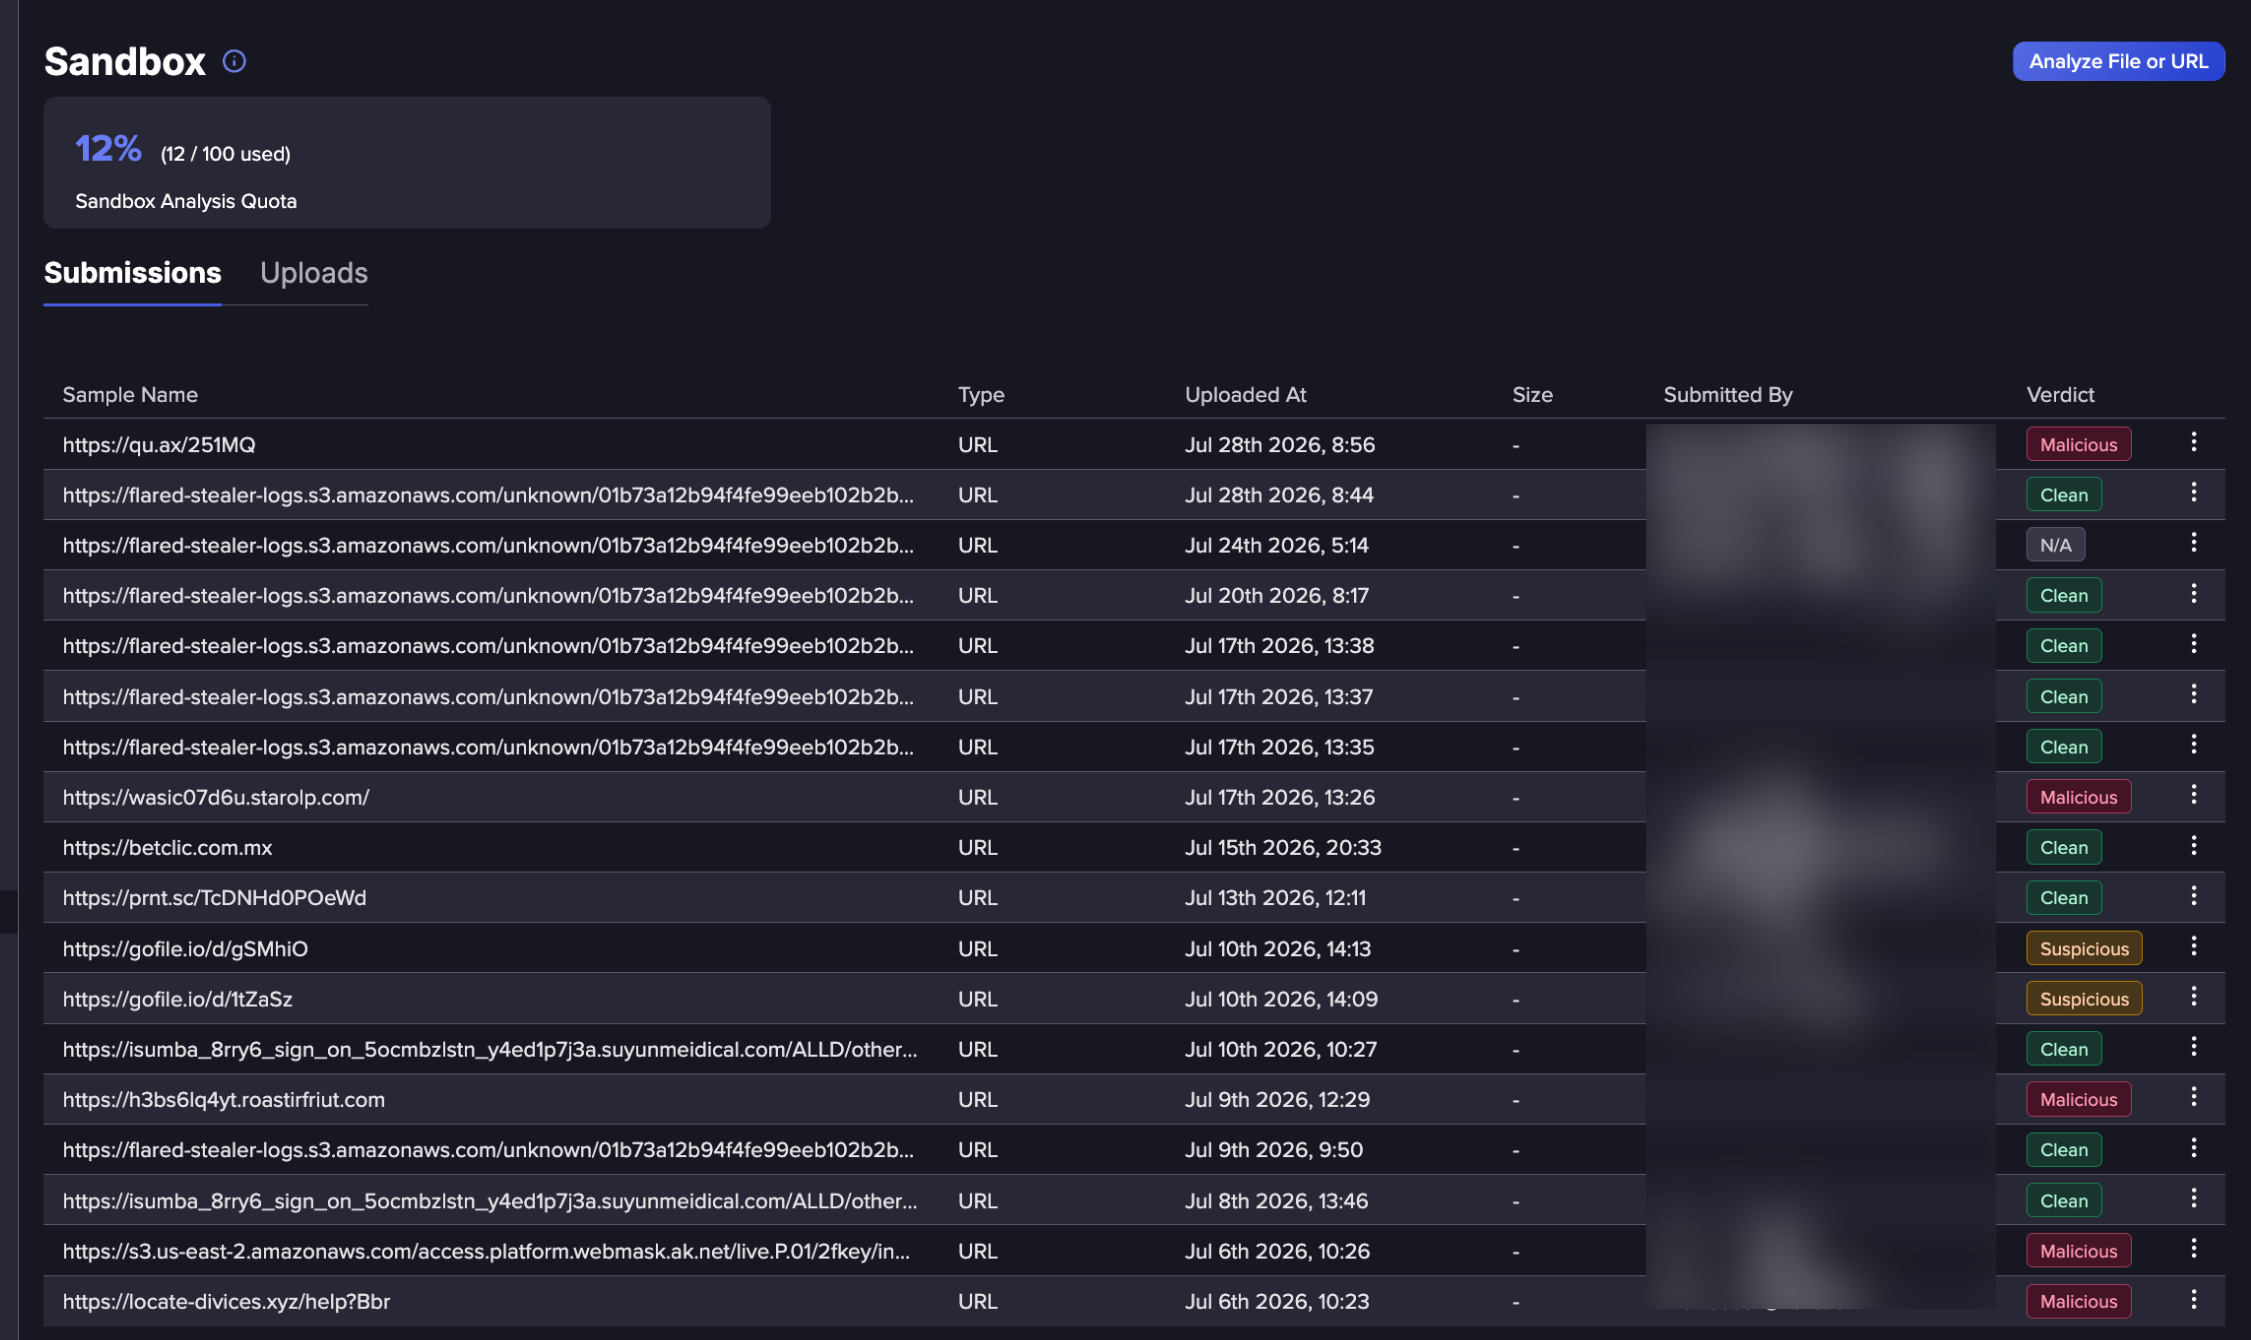
Submitted files and URLs appear in the Submissions list along with their type, upload date, size, and who submitted them. Once analysis is complete, the Verdict column updates to show the result, such as Clean. Click on a submission to open its full report, which presents findings organized by type: execution behavior, network activity, IOCs, and MITRE ATT&CK mappings. Severity ratings help prioritize what to act on first.
Operationalize extracted IOCs
IOCs extracted from the report, such as C2 domains, hashes, and network artifacts, can be pushed into Feeds and applied to the detection stack. This closes the loop from submission to active blocking.
Pivot to the Intelligence Browser
If the analysis surfaces an actor, malware family, or domain worth investigating further, pivot to the Intelligence Browser to pull the full entity profile, attribution, and relationship context.
Analyzing Stealer Logs
Files discovered in stealer logs can be sent directly to the Sandbox for analysis without needing to download them first.
Navigate to the Tenant Feed from the Events page.
Click on an Event, such as an Infected Device on Stealer Logs, to view its details. Go to the Content tab.
Click Downloads, then select Interact in Sandbox.
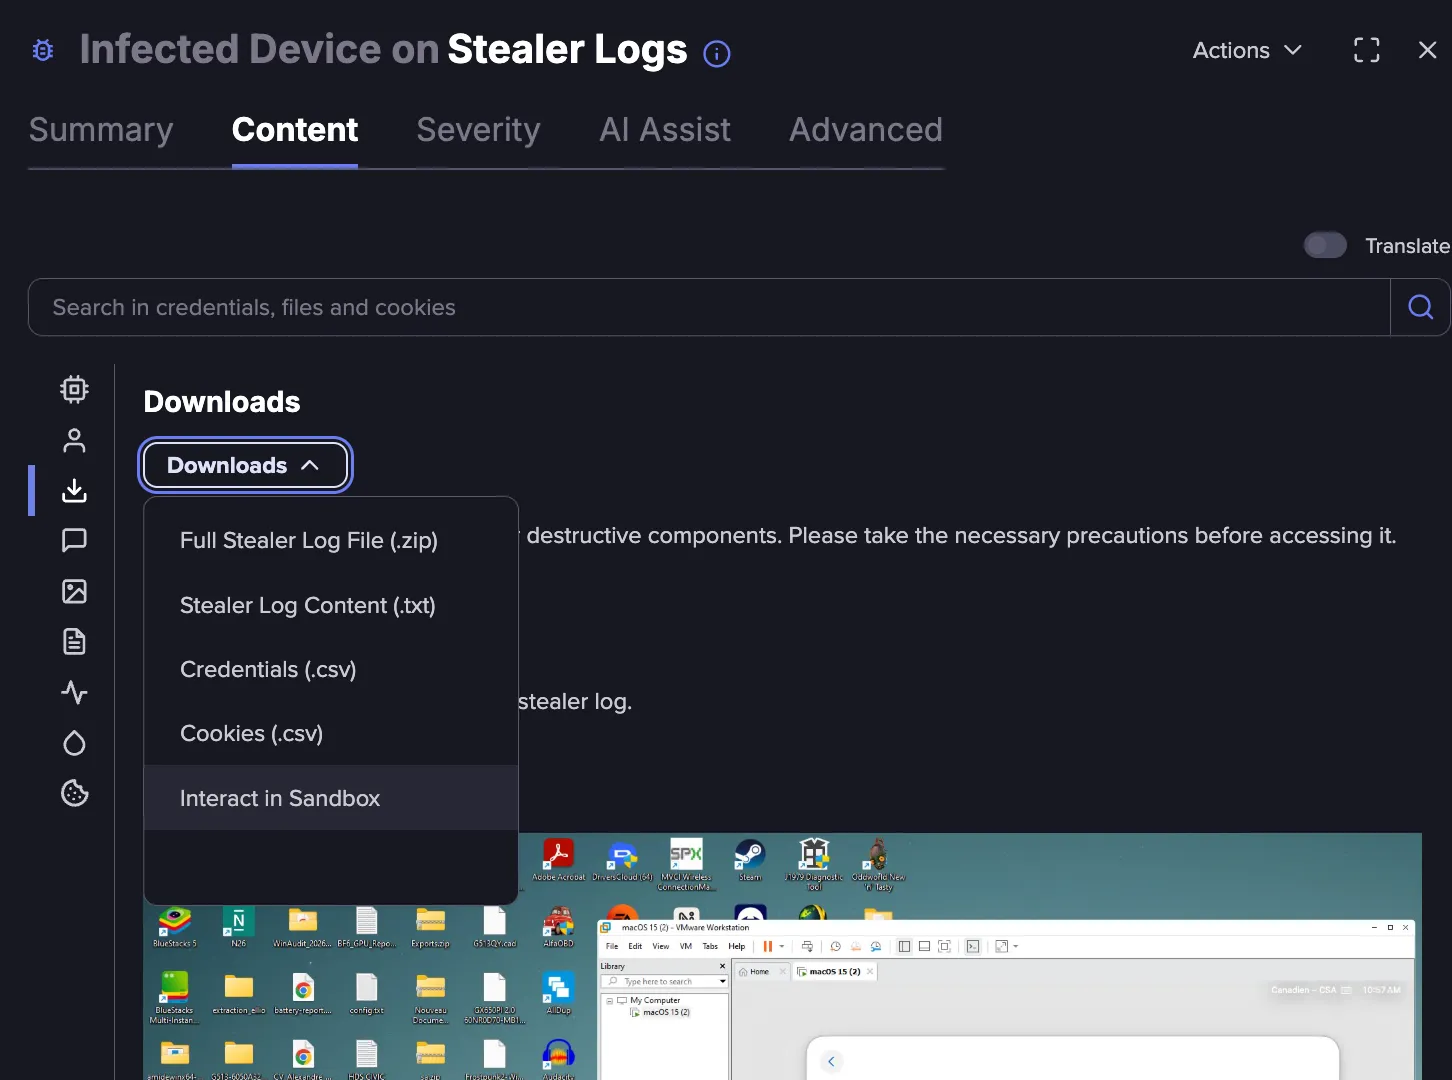
Select Interact in Sandbox as the analysis mode. The zip file is sent to the Sandbox automatically, and interactive analysis begins in an isolated virtual machine. This makes it possible to investigate malware discovered inside a stealer log without leaving Flare or exposing local infrastructure to risk.
Once inside the Sandbox, a browser window opens in the virtual machine and the file is downloaded automatically.
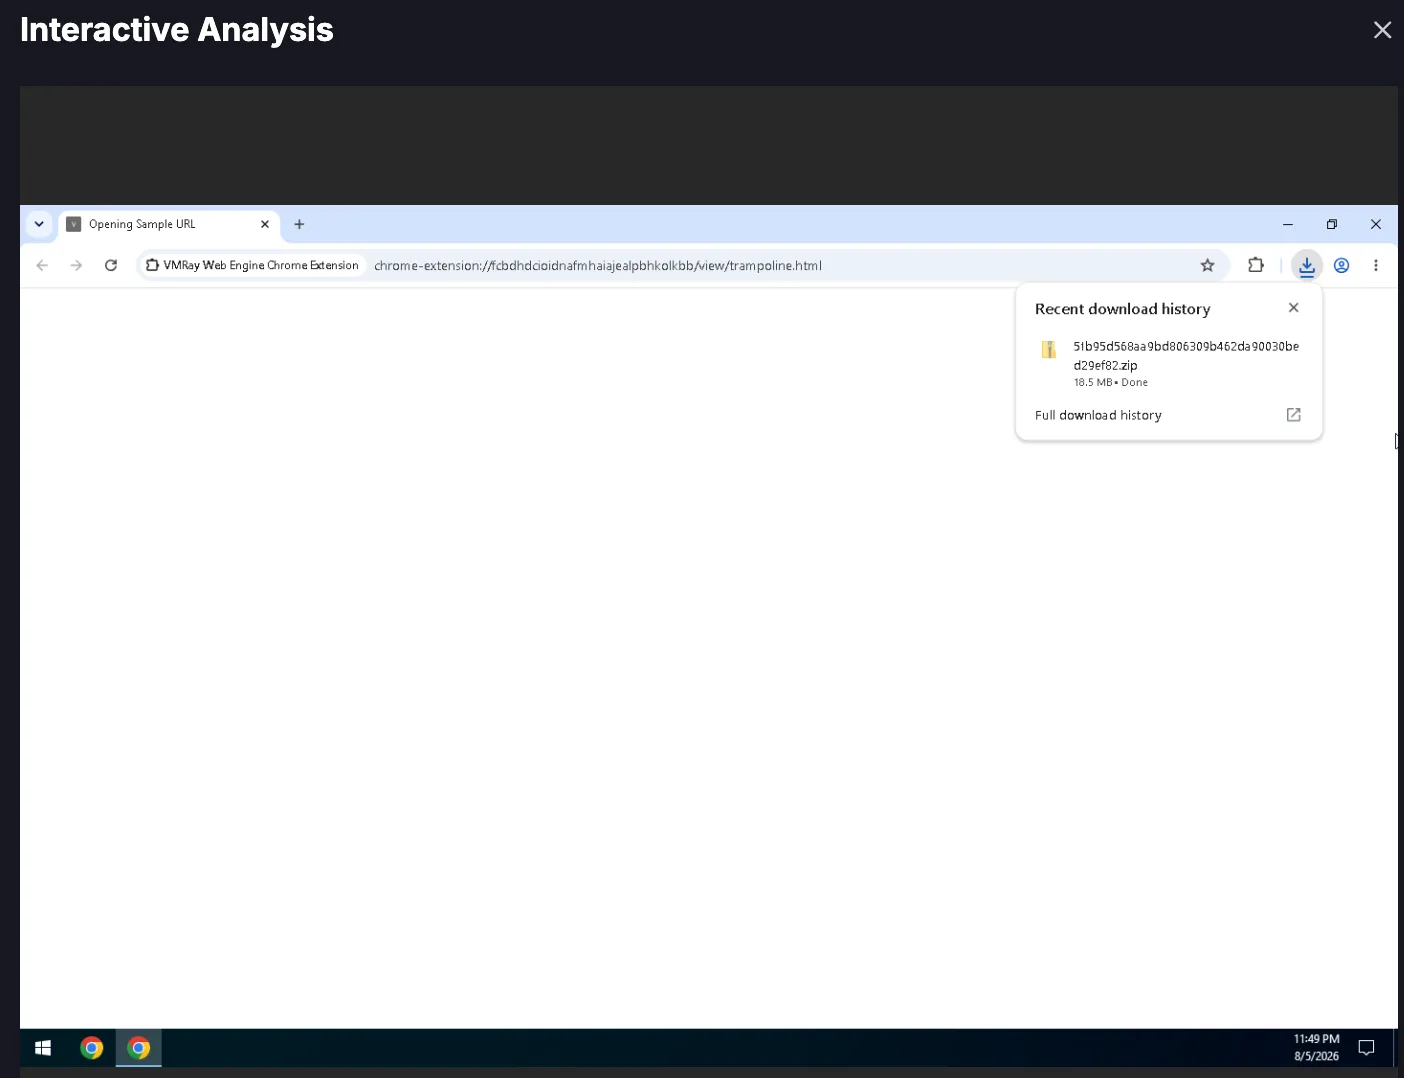
Note: Keep the browser window open for the length of the session.
Go to the Downloads folder in the virtual machine and extract the zip file to investigate it.
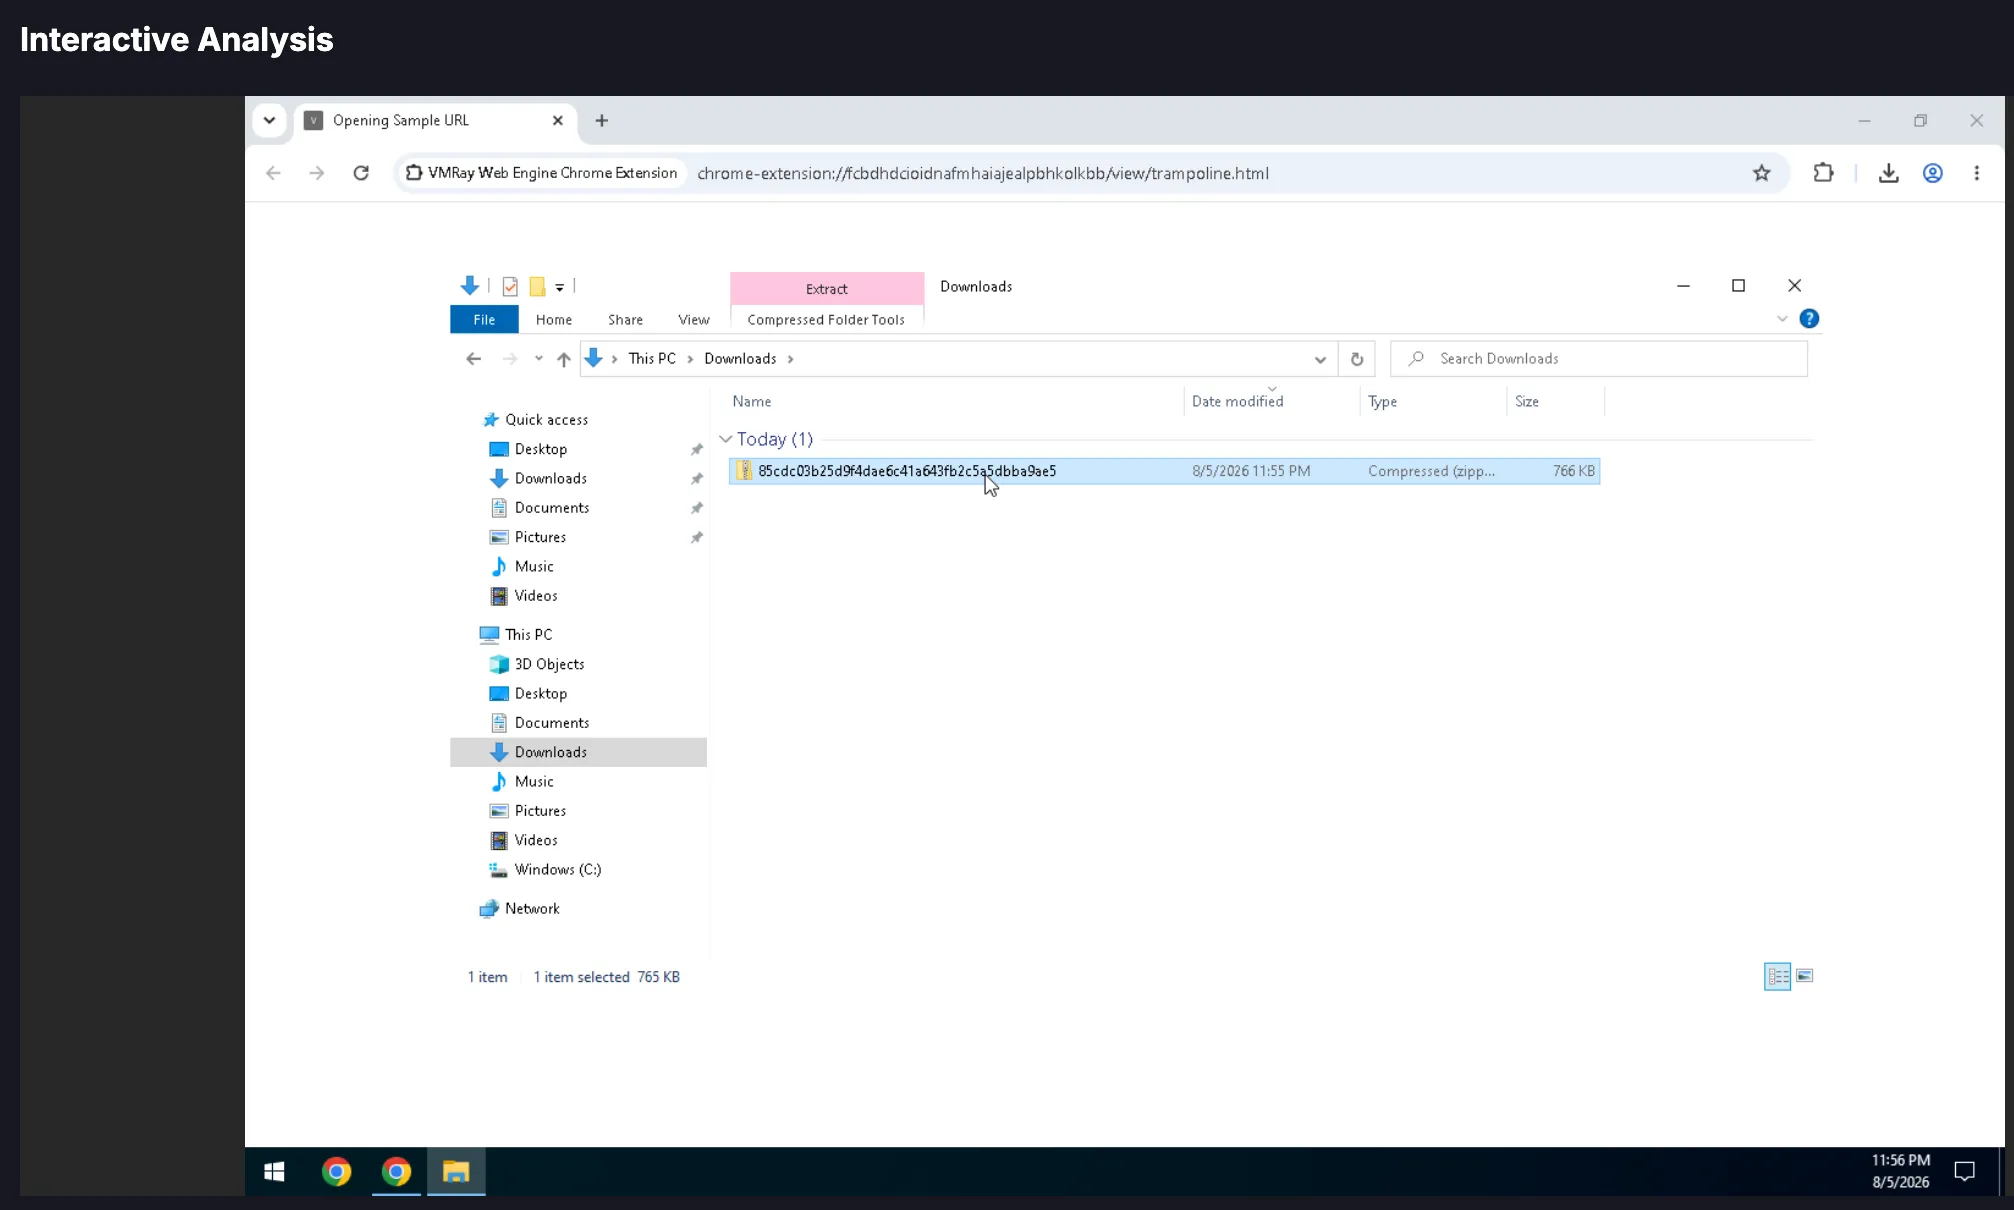
Once the investigation is complete, close the virtual machine.
Analysis Results
After a file/URL is submitted, the analysis then processes in the background to generate a report, which can take up to 10 minutes. When it completes, the verdict for the file appears in the list next to the file/URL name.

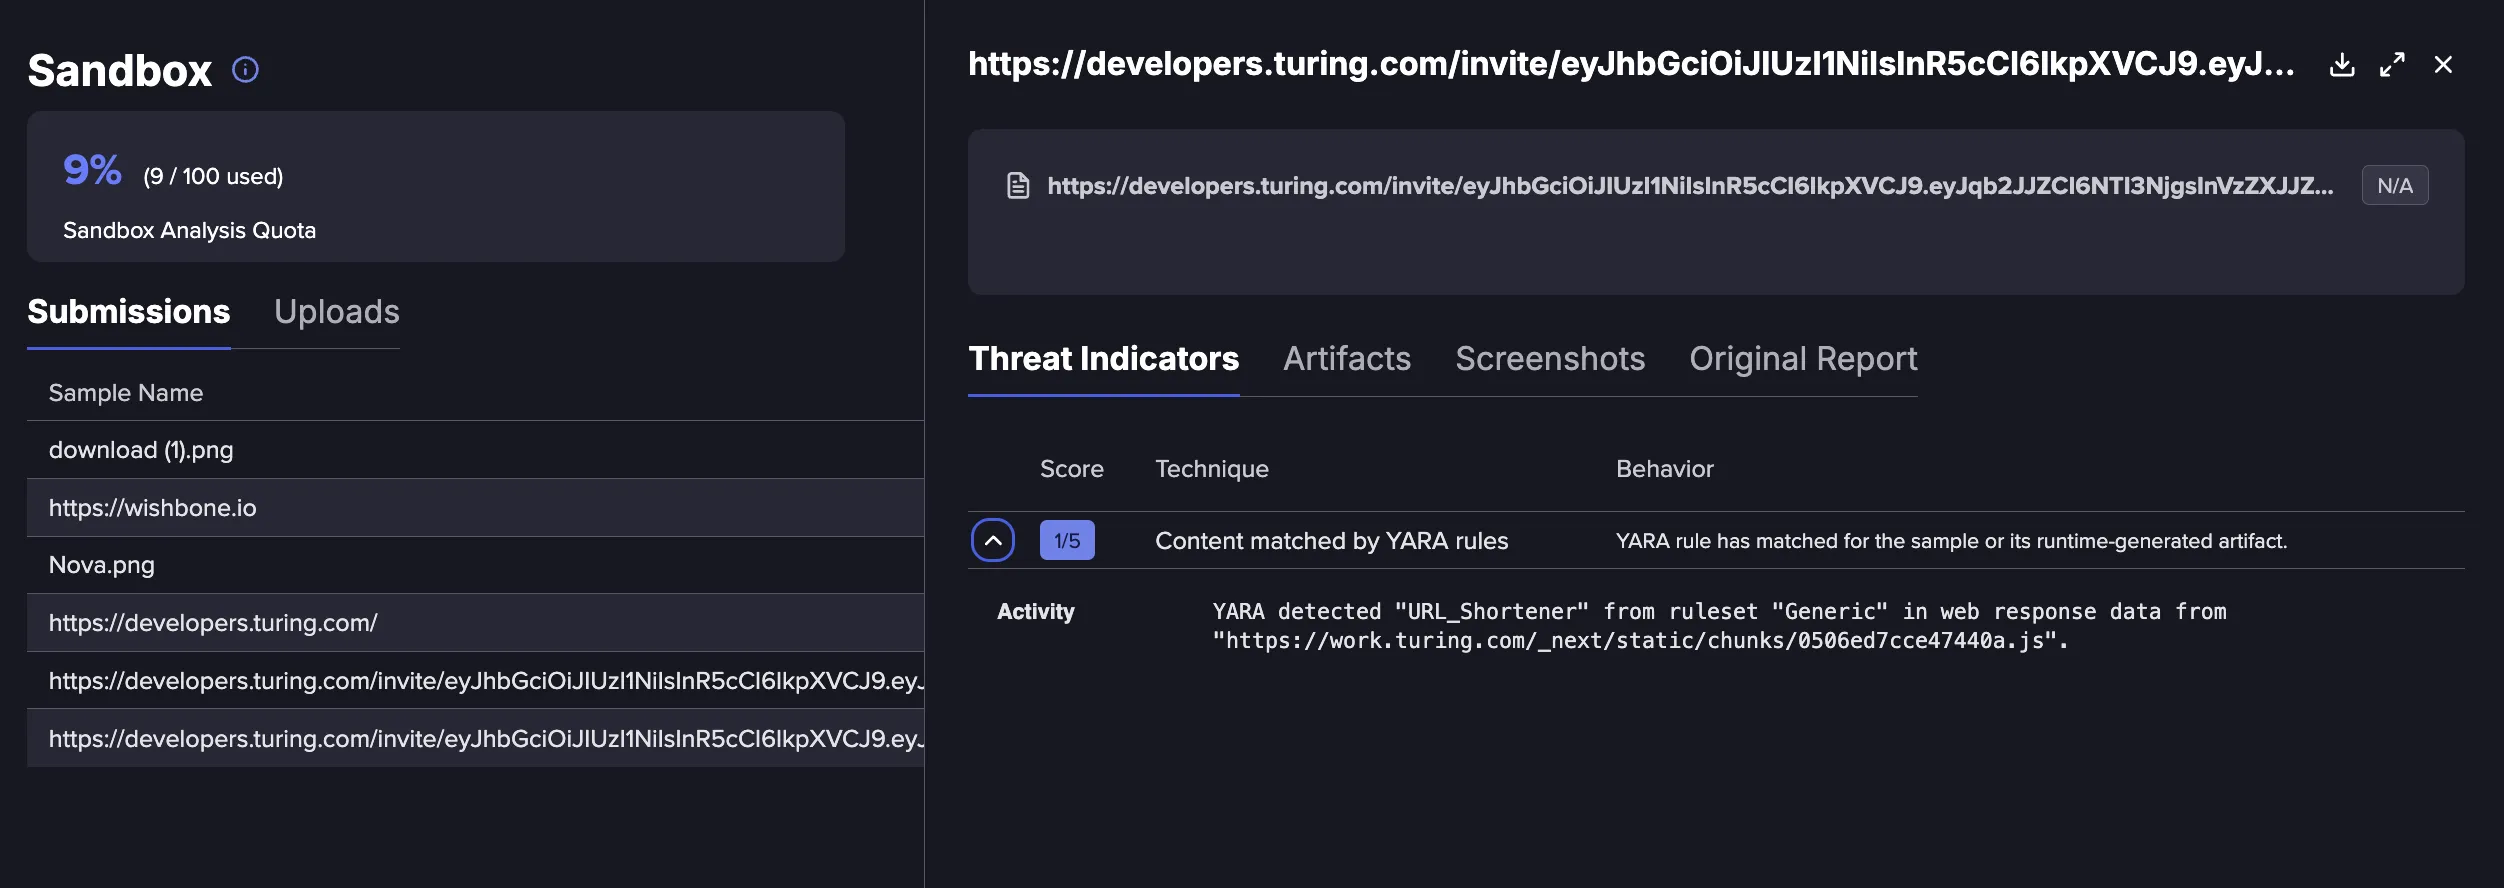
Click on a file to view details of the analysis. Here you can review the verdict, any matched YARA rules, MITRE TTPs, and more.
Threat Indicators
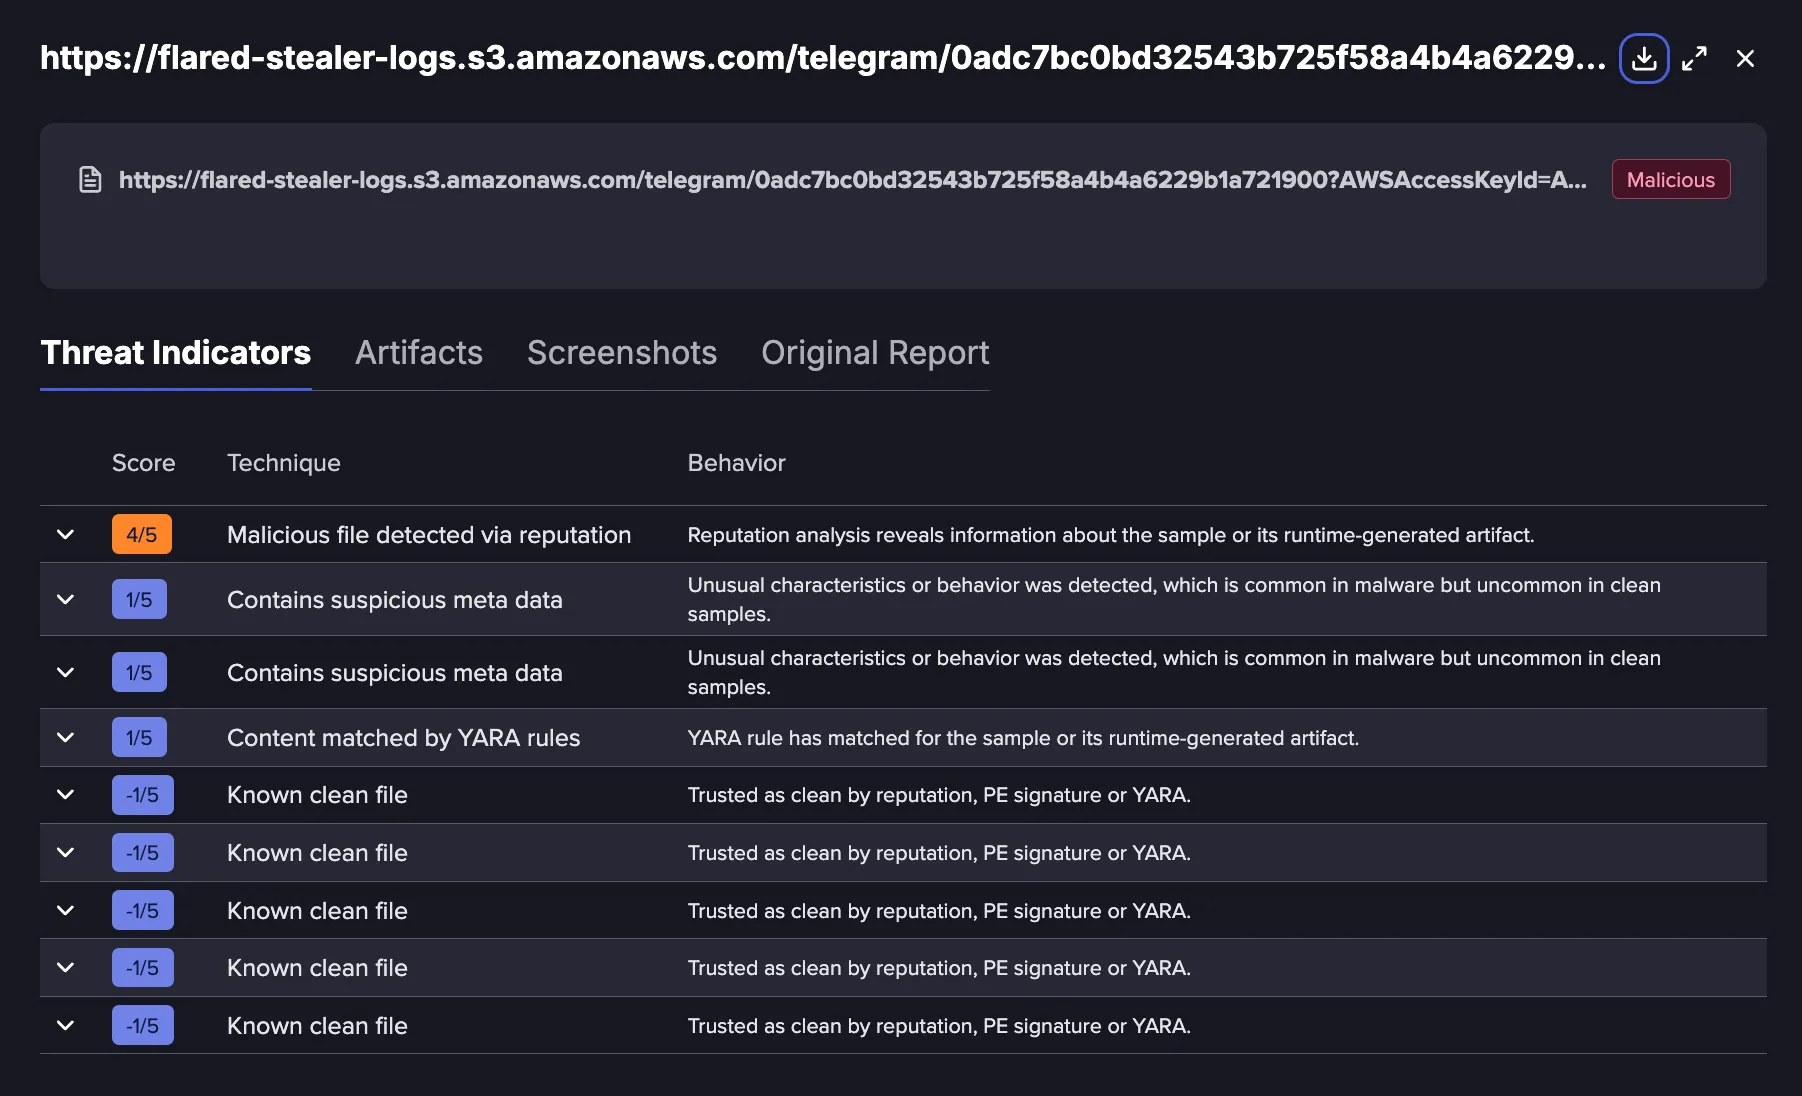
Threat Indicators are behavioral patterns and rules flagged during analysis that point to possible malicious intent. They are distinct from IOCs, which are network artifacts like domains and hashes, rather than behavior. In VMRay, these are referred to as VTIs (VMRay Threat Identifiers).
Each indicator is scored on a five-point scale. The scale is not cumulative or linear, and a higher-scoring indicator carries far more weight than several lower-scoring ones combined. For example, one score of 4 out of 5 is enough to automatically flag a sample as malicious, while three scores of 2 out of 5 would only be considered suspicious.
See The VMRay Threat Identifier (VTI) Scoring System for more information.
Artifacts
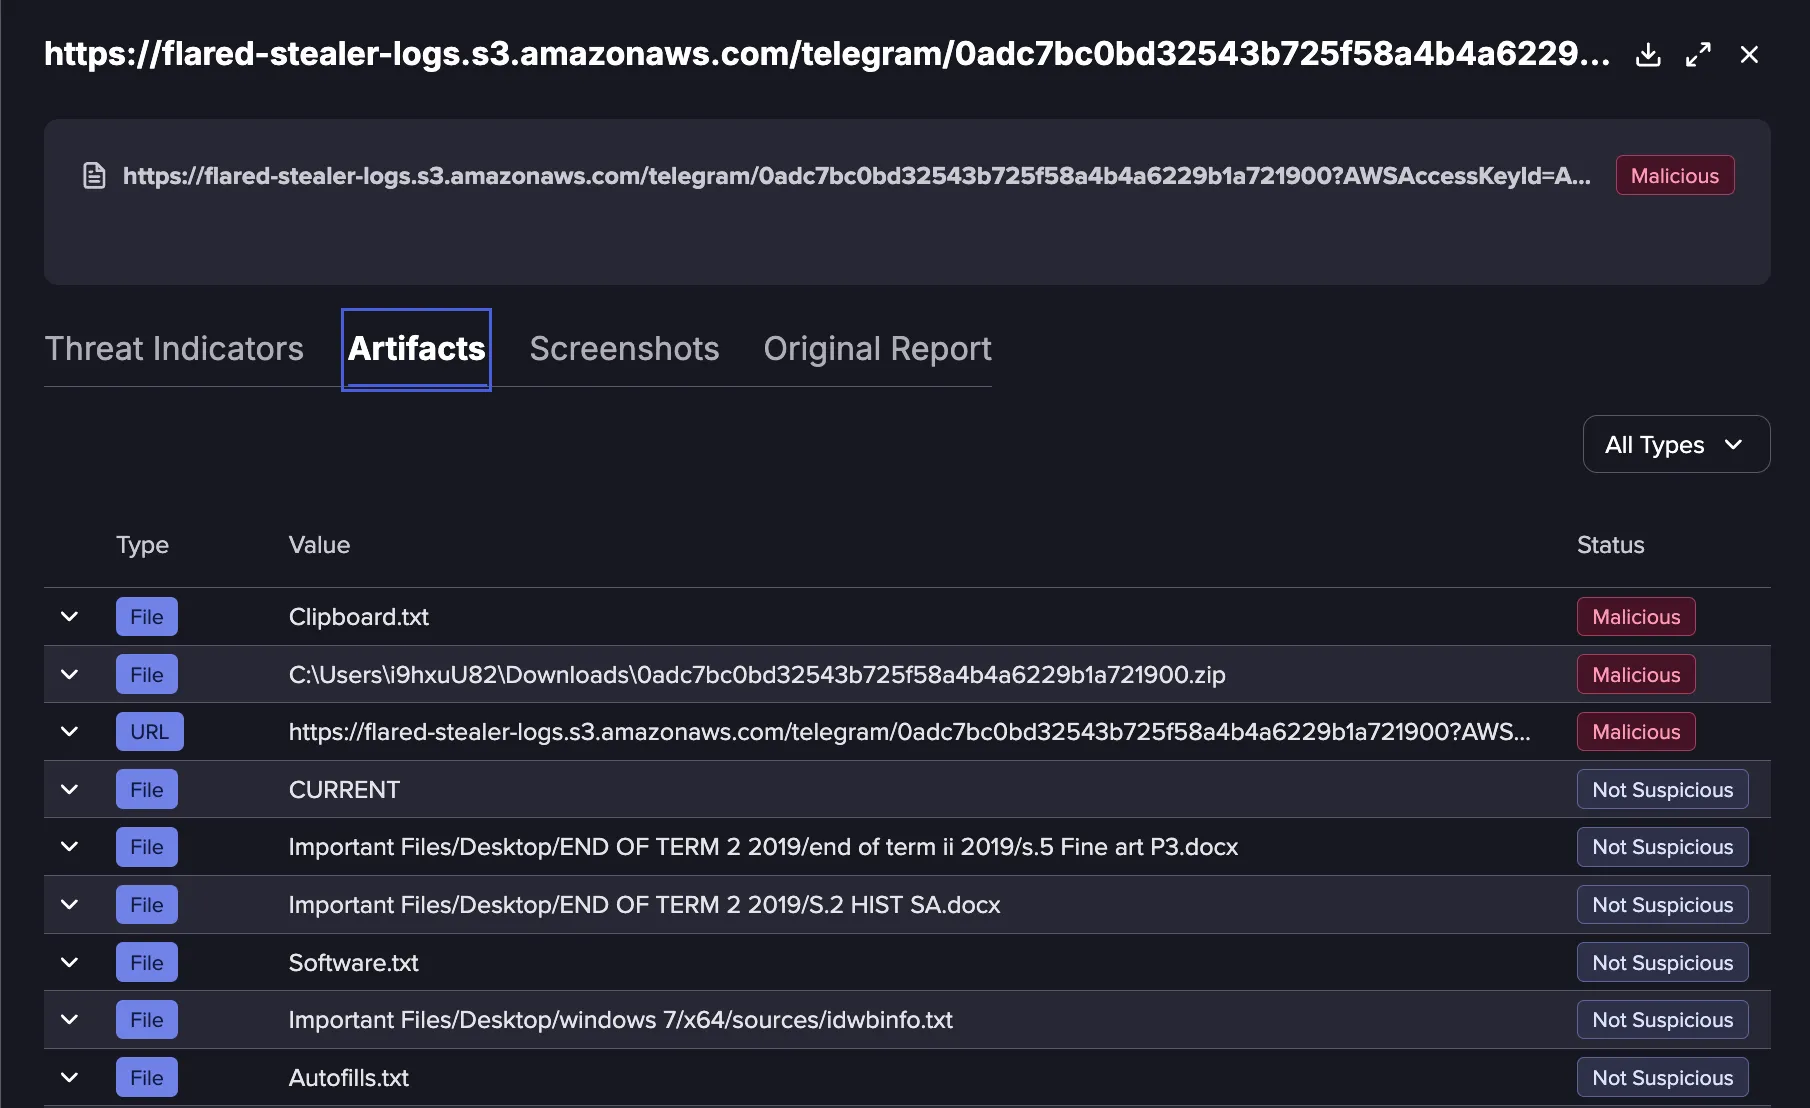
Artifacts are pieces of forensic data observed during an analysis. They can include files, URLs, IPs, processes, and registry entries, among other items. Not every artifact is malicious or cause for concern, since each one represents just a piece of the overall picture. IOCs are a subset of Artifacts, for example, one malicious artifact or several suspicious artifacts together.
In Flare, artifacts are extracted from dynamic analyses and displayed in the Artifacts tab of the submission drawer. Each row can be expanded to see additional information about the artifact.
See Indicators of Compromise (IOCs) and Artifacts: What’s the Difference? for more information.
Screenshots
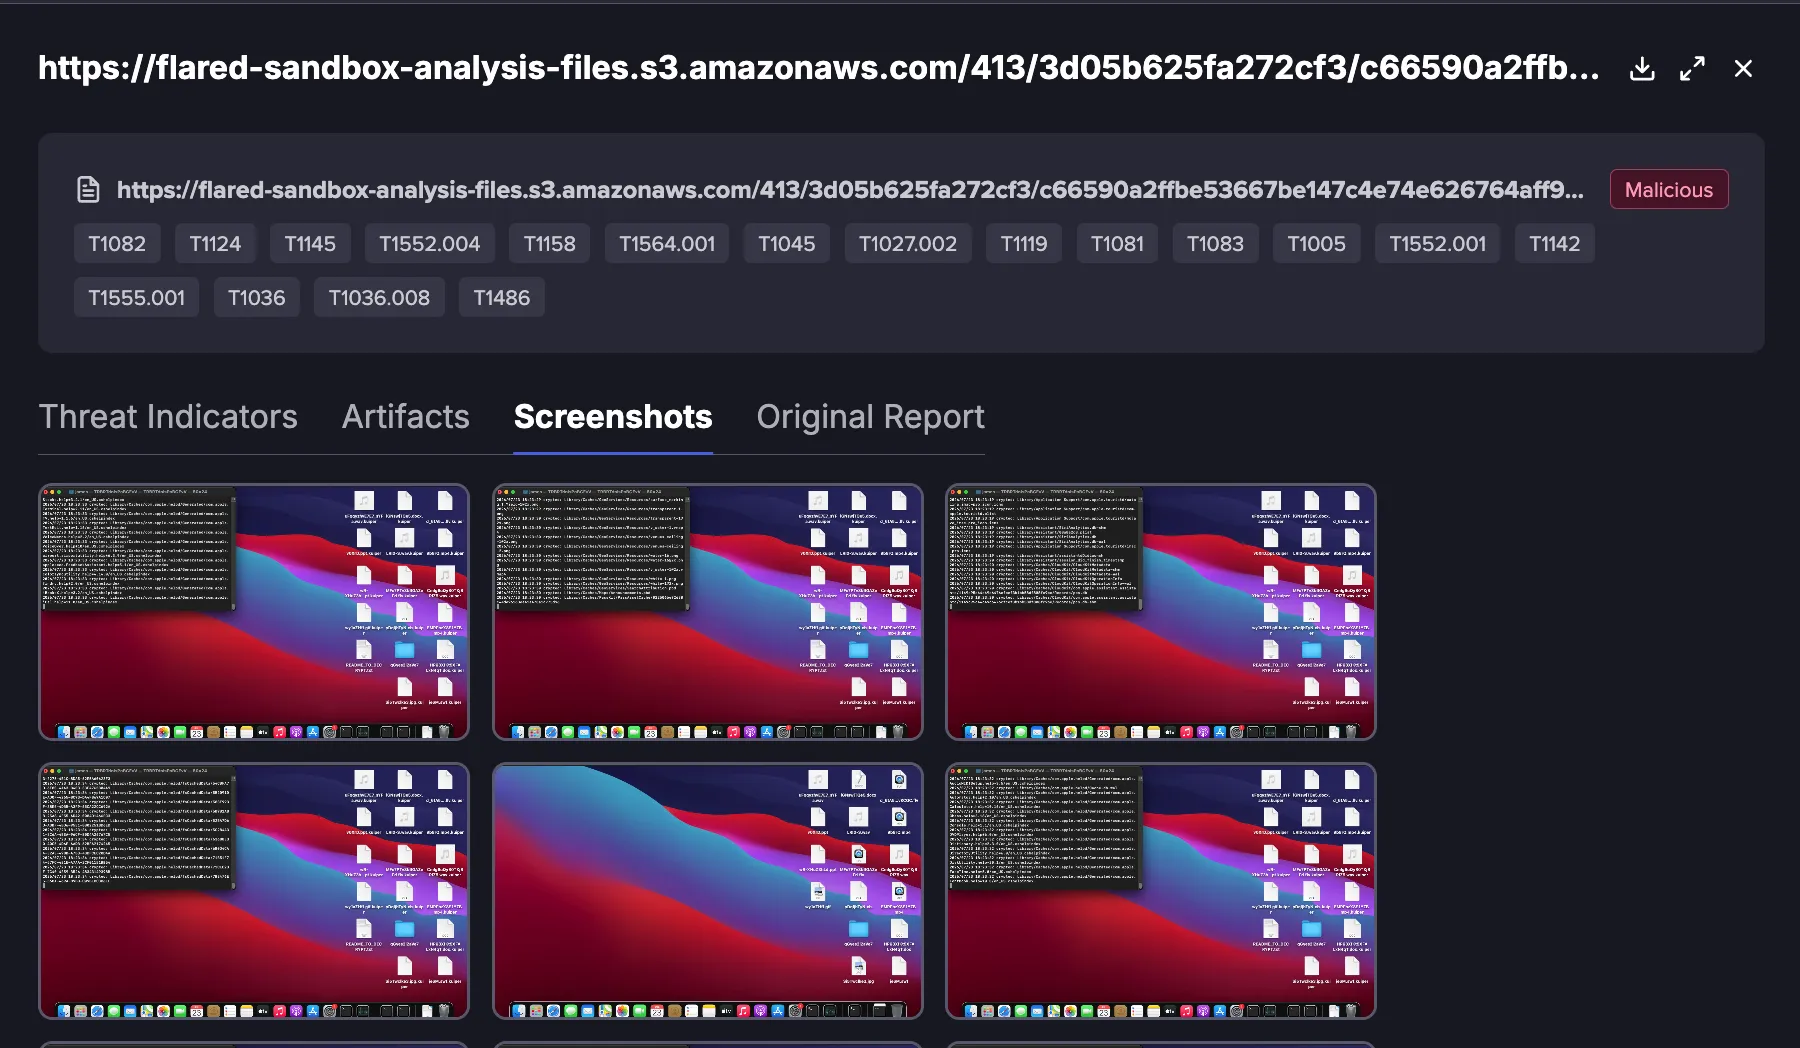
The Screenshots tab shows the same screenshots that appear in the dynamic report, presented in a larger and clearer view. Screenshots are taken automatically by VMRay during analysis, so the timing and content of each screenshot cannot be adjusted or made more specific.
Original Report
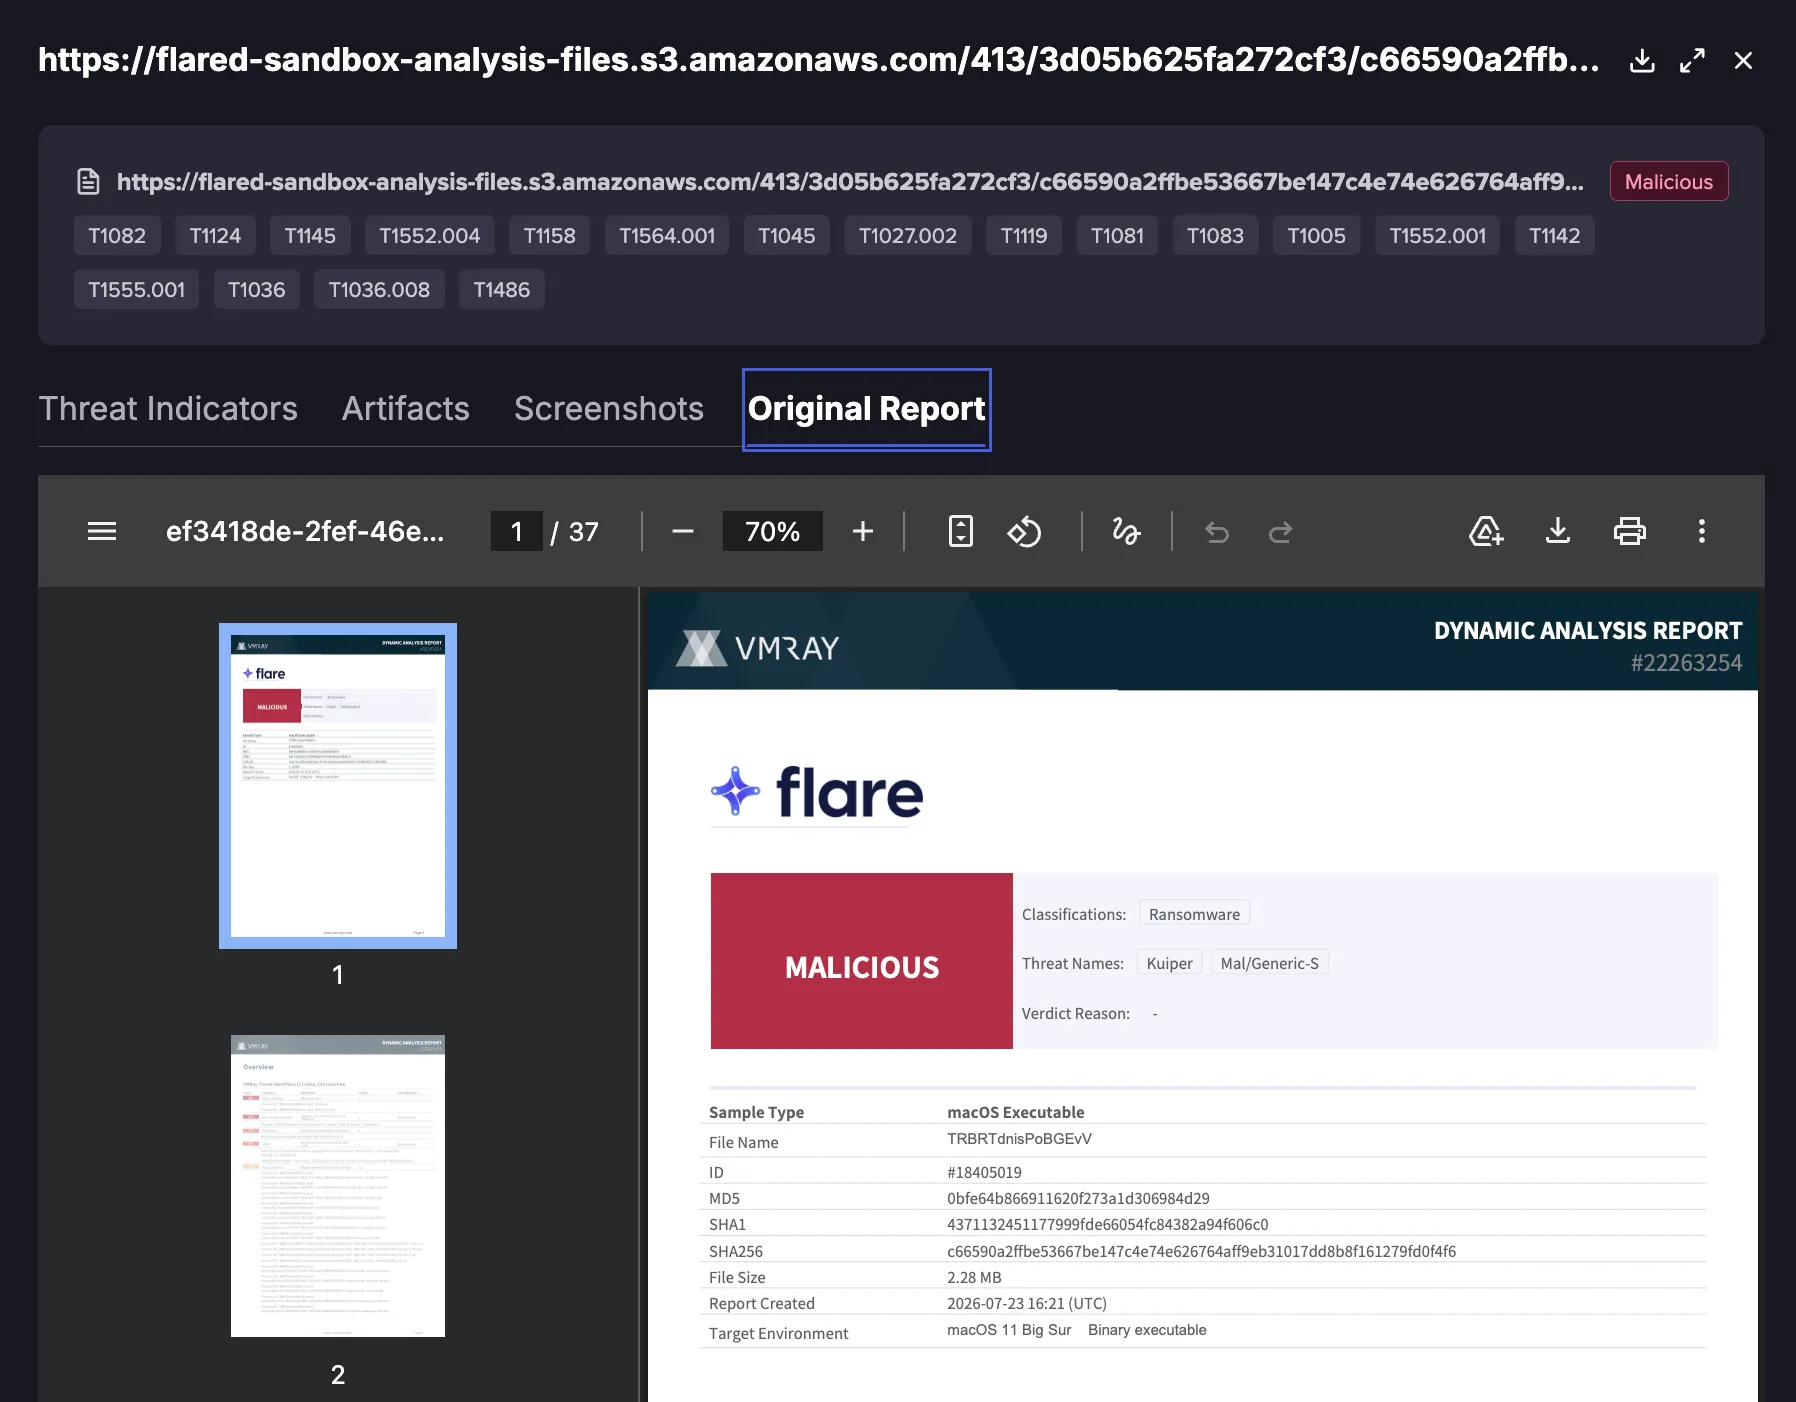
This is the PDF report generated by VMRay. To download the report, use the three-dot menu. The Sandbox provides two reports:
- Sample Report: a streamlined report showing the verdict and selected IOCs.
- Analysis Report: a detailed report covering the processes, registry keys, websites, and other activity associated with the sample.
Types of Indicators of Compromise
Flare's sandbox can return the following types of Indicators of Compromise (IOC):
- Files
- Filenames
- Domains
- Emails and Email addresses
- URLs
- IPs
- Processes
- Mutexes
- Registry entries (including Registry Key Types if available)
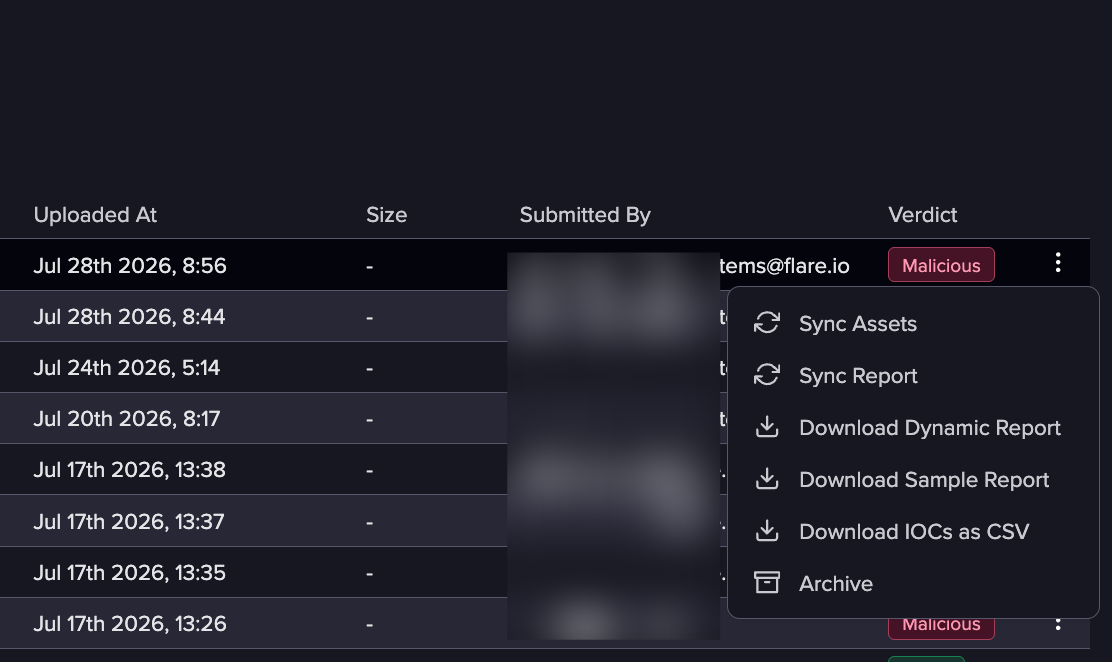
To download the associated IOC file expand the menu on the right of each entry, and download IOCs as CSV. This will return the IOCs in SHA256.
Using API to Upload Files
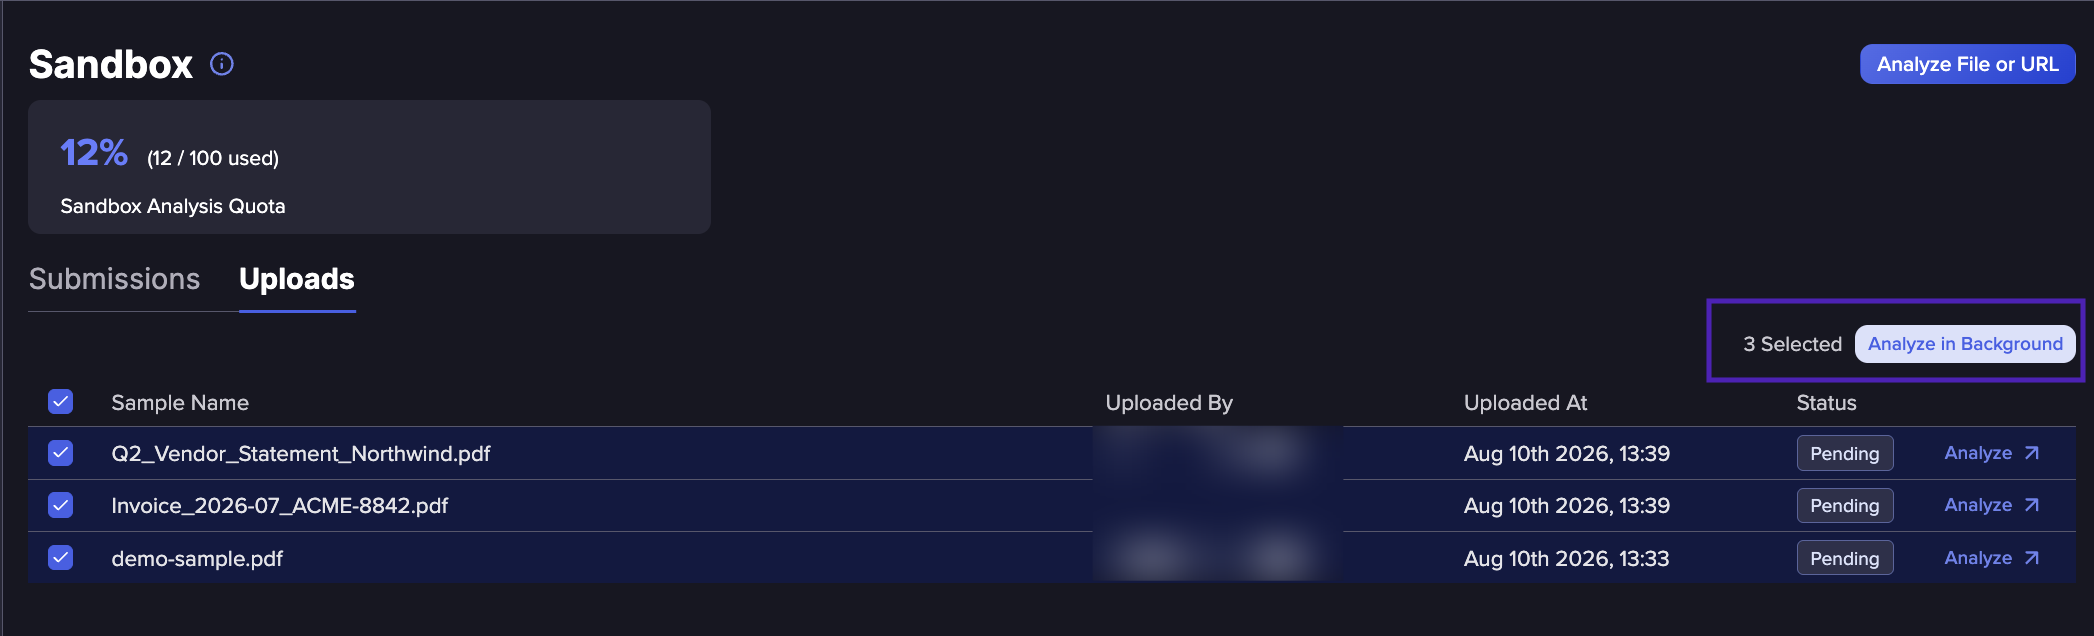
You can use Flare's API to upload files for Sandbox analysis, making it possible to add files programmatically as part of existing workflows. Files uploaded through the API appear in the Uploads tab, which sits alongside the existing Submissions tab.
For more information on uploading files to the Sandbox, see our API documentation.
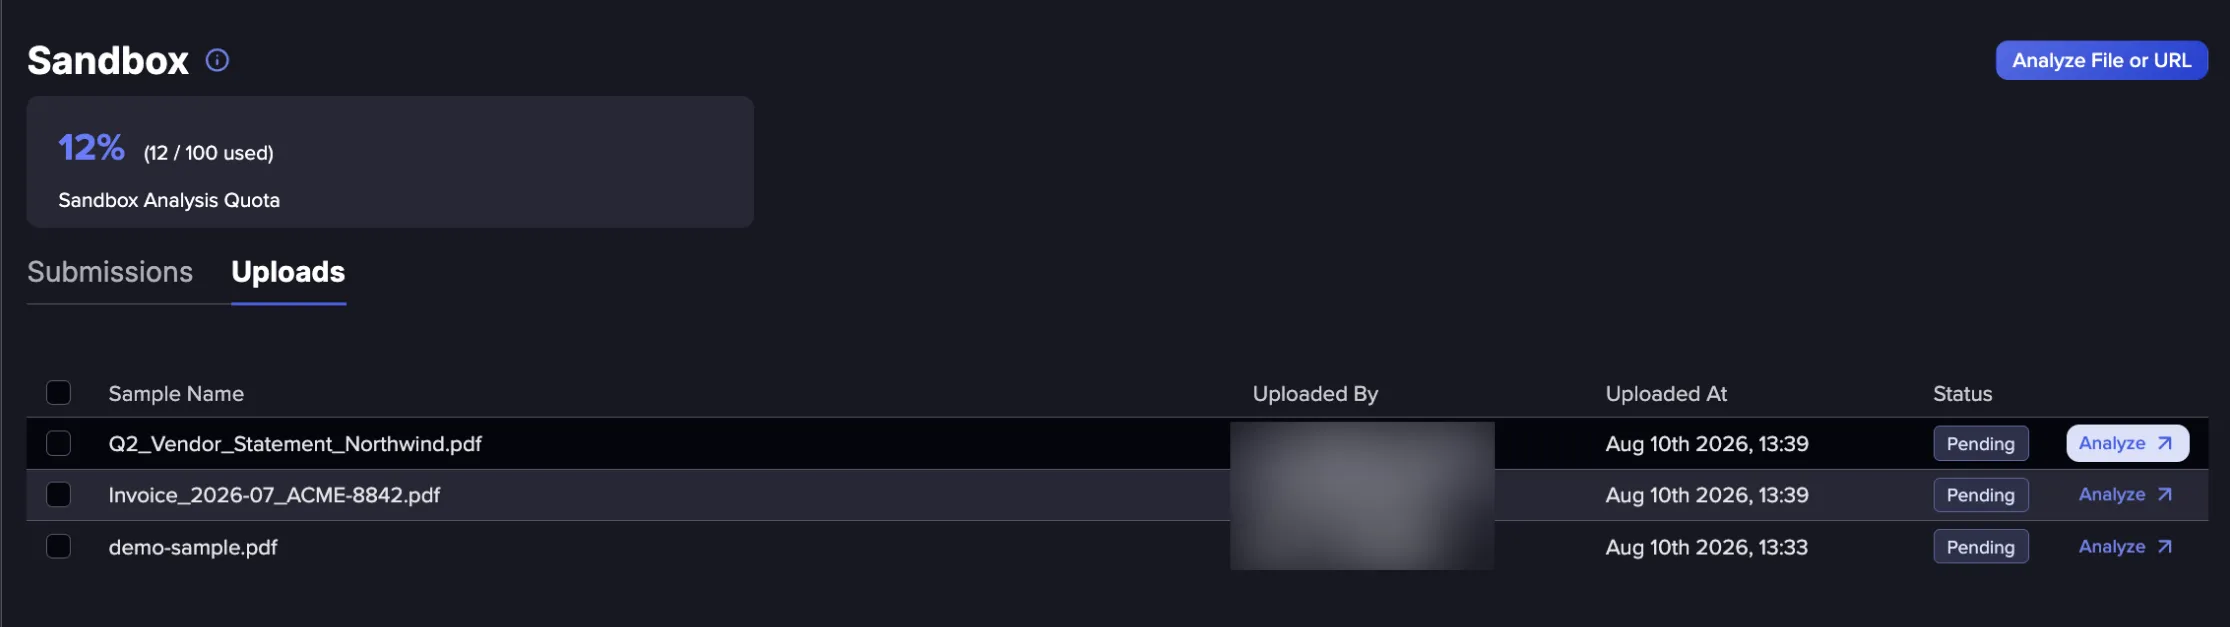
From the Uploads tab, click Analyze to investigate the file in the Sandbox or run an automated background analysis. Uploading a file through the API does not trigger analysis automatically.
To analyze several files at once, select multiple files and click Analyze in the Background. Interactive analysis is limited to one file at a time, so bulk analysis must use the background option. Choose one file at a time for interactive analysis.