Splunk App
The Flare Splunk App brings your Flare Events into Splunk Enterprise. After you connect the app to Flare and select the Tenants you want, Flare Events are ingested into a Splunk index on a schedule you set, so you can view, search, and build automations on that data alongside the rest of your data in Splunk.
- Access Full Event Details: Go beyond alert summaries and directly dive into detailed event information in Splunk.
- Enhance Security Workflows: Use Flare data to perform correlations, enrich investigations, and automate responses within Splunk, all tailored to their environment.
- Customize and Control: Meet compliance and operational requirements with an on-premises app designed to fit enterprise needs, allowing for high control over data access and usage.
Installing the Splunk App
Follow these steps from the Splunk platform to install Flare's Splunk app:
From your Splunk instance, go to Apps -> Find More Apps.
Search the store for Flare, and click Install to install the app.
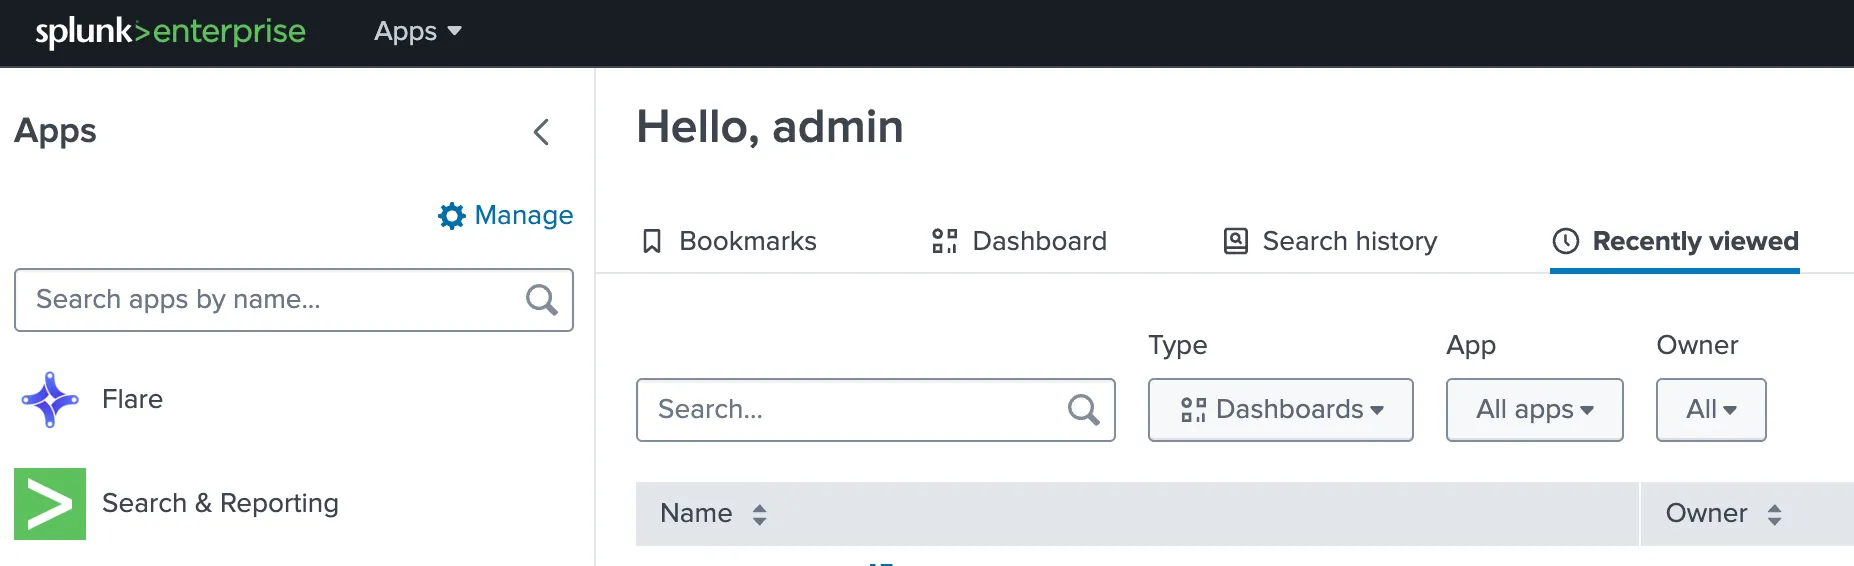
Once installed, the Flare app appears in the left sidebar under Apps.
Configuration
Follow these steps to complete the configuration of the Flare Splunk app:
Select the Flare app from the left navigation, and go to the Configuration tab.
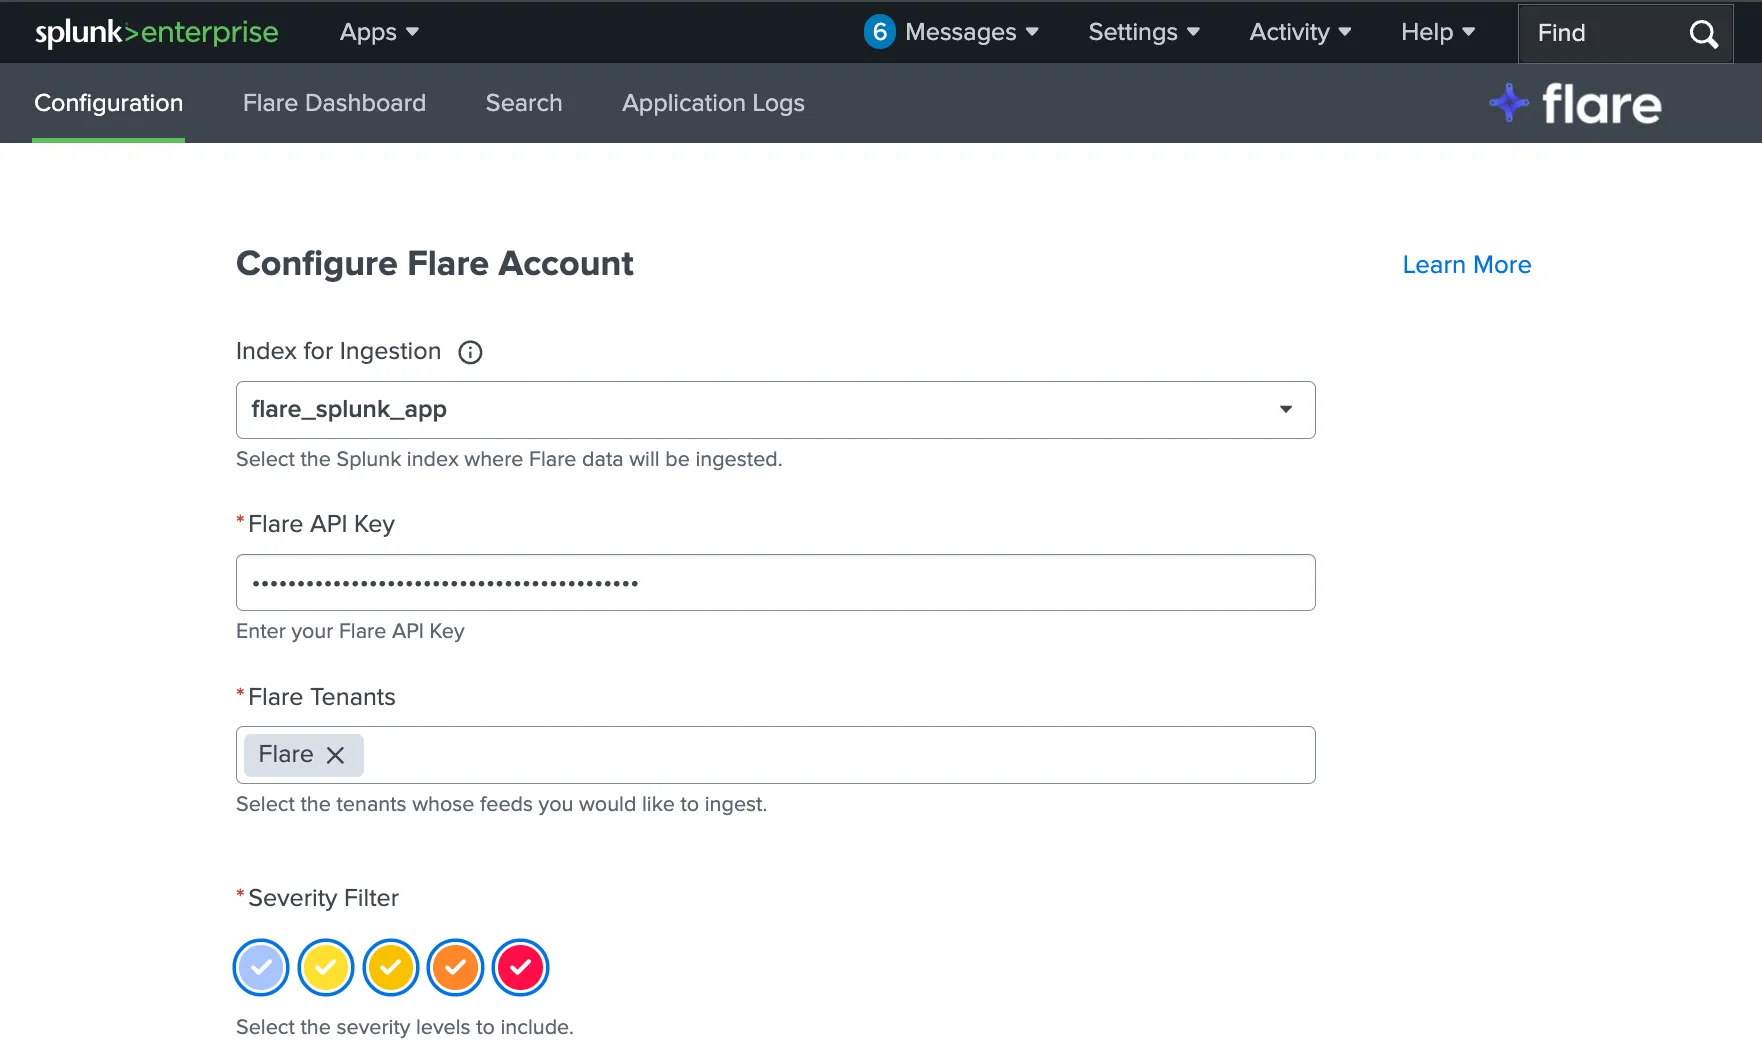
Choose the index the app will ingest data into. An index is a Splunk data store, similar to a log database, that the app writes Events into.
- You can select an index that already exists in your Splunk instance or create a new one for Flare. If you create a custom index, go to Advanced search » Search macros » flare_index in Splunk and update the macro to point to your new index.
- If you create a custom index, go to Advanced search -> Search macros -> flare_index in Splunk and update the macro to point to your new index.
Enter the API key the app will use to connect to Flare. For information on how to create an API key, see Generate an API Token.
Once your API key is entered, the Tenants available to your organization are loaded. Select one or more Tenants to synchronize into Splunk. The app pulls the Events from each selected Tenant into your chosen index, based on the filters you set below.
Use the Severity Filter to select which severity levels to include.
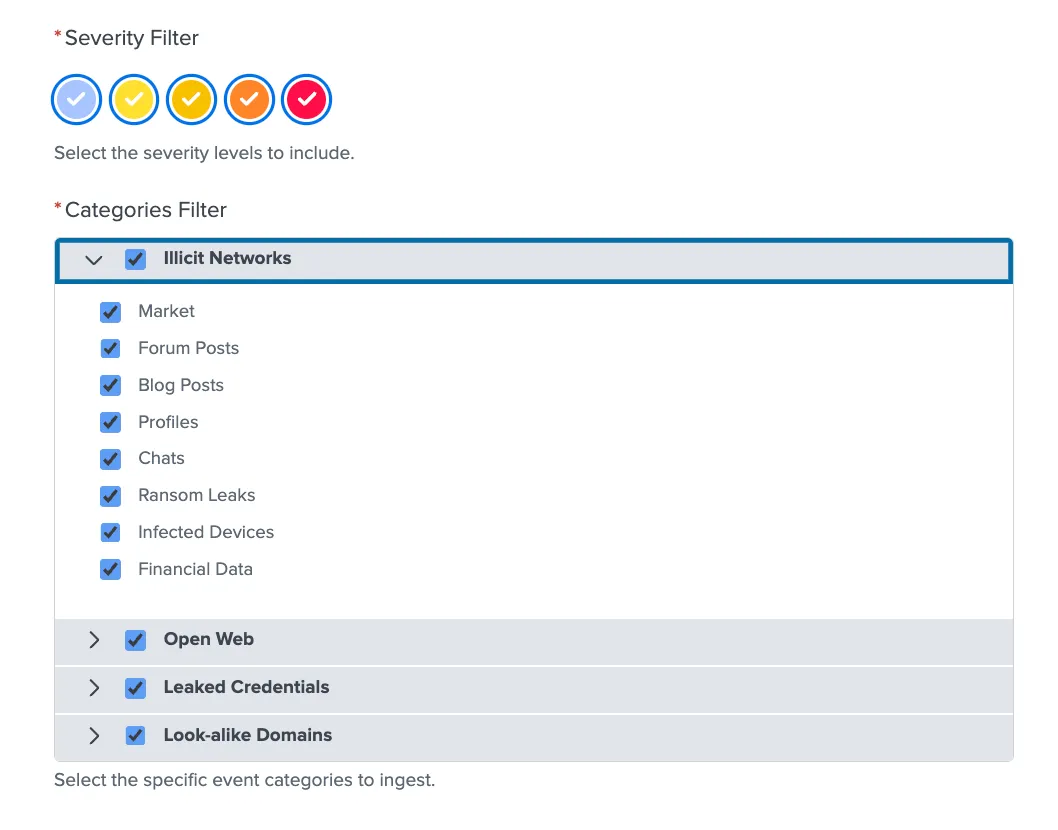
Use the Categories Filter to select which Event categories to ingest. Expand a category to select its subcategories. The categories correspond to your Flare data sources, such as Illicit Networks, Open Web, Leaked Credentials, and Look-alike Domains.
The Initial Backfill Range setting sets how many days of past Events the app ingests on its first run, up to a maximum of 180 days.
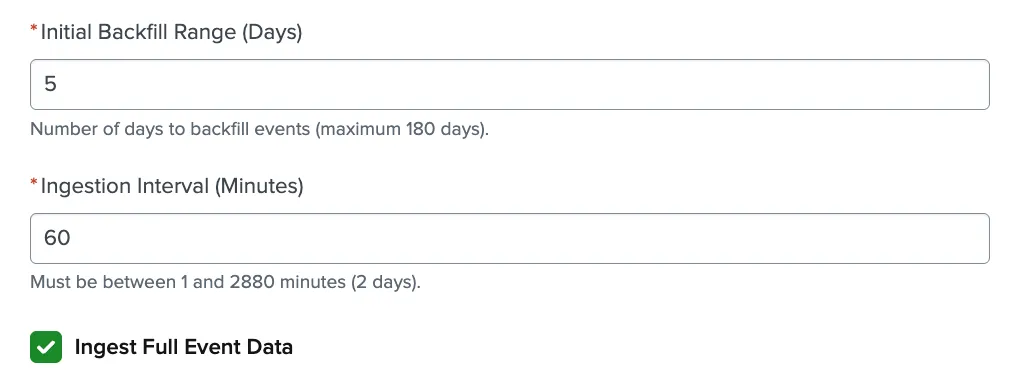
The Ingestion Interval setting sets how often the app pulls new data after that, in minutes. The value must be between 1 and 2880 (2 days). For example, 60 runs the app once an hour and 1440 runs it once a day. Choose an interval based on how current you need the data to be, how much data you expect to ingest, and the load on your Splunk instance.
The Ingest Full Event Data setting controls how much detail is stored for each Event.
- When it is selected, the app ingests the complete Event schema, including detail such as a matched look-alike domain or the host information found in a stealer log. Choose this if you want full Event data in Splunk for correlation, automation, or alerting on specific fields.
- When it is cleared, the app ingests only the core fields for each Event, such as the Event UID, key highlights, and the Tenant and Identifiers the Event matched. This keeps storage use lower and suits teams that mainly want to know when an Event appears.
Log Level sets the verbosity of the app's own application logs, which are used for troubleshooting. The default is INFO. If you are diagnosing an issue, set it to DEBUG to capture more detail, then return it to your usual level once the issue is resolved. A higher verbosity uses more storage because the app logs more, but it does not change how Events are ingested.
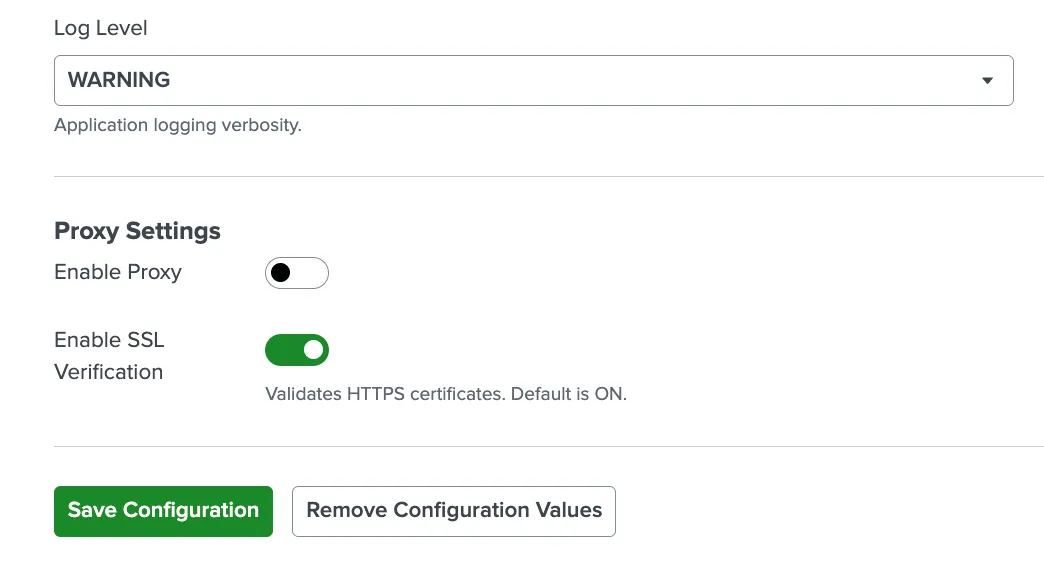
If your Splunk instance reaches the internet through a proxy, turn on the Enable Proxy toggle and enter the proxy server address and its authentication details. This allows the app to ingest data on hosts that do not have direct internet access.
Enable SSL Verification to validate the HTTPS certificates of the connections the app makes. While it is on, ingestion fails if a certificate cannot be validated, which helps protect the connection against interception.
When all configurations are done, select Save Configuration. To clear all values, select Remove Configuration Values.
Migrating From the Legacy Splunk App
If you are migrating from the Legacy Splunk Applegacy Splunk app, follow these steps to ensure a smooth transition:
Record your current settings from the legacy app’s configuration page: API key, tenants, severity and category filters, backfill days, index, and whether full event data was enabled. You will re-enter these when you configure the new app.
Disable the legacy app’s scripted input (under Settings » Data inputs » Scripts) so the same Events are not ingested twice.
Install and configure the new app. Ingestion starts only once you save a valid configuration.
Expect a backfill. On its first run, the new app re-ingests its backfill window (30 days be default), so Events from that period are stored twice, once under each schema. Deduplicating across the two is not practical, because the structure and the _time value differ.
Update your alerts and reports to use the new app’s fields. The legacy saved searches (Flare Search and Severity) are replaced by the new app’s reports, which are prefixed Flare -.
Once the new app is successfully configured, remove the legacy app and delete its stored credentials (under Settings » Passwords, the realm flare_integration_realm). The legacy API key remains in Splunk until you delete it.
Post migration considerations
- Running both apps at once duplicates Events: It is recommended to remove the legacy Splunk app. If they run together, the same Events can get ingested by both and result in duplicate Events.
- Point the search macro at your index: Dashboards and saved searches read through a search macro named flare_index, not the index directly. If you ingest into an index other than the app’s default, update this macro to match under Settings » Advanced search » Search macros, or every dashboard and saved search returns empty. This is the same macro covered in Configuration.
- Legacy Events stay in the index: Uninstalling the legacy app does not remove the Events it already ingested; they remain in whichever index it wrote to. They fall out of the new app’s own dashboards and searches but can inflate totals in loosely filtered custom searches, so use a separate index for the new app or time-bound your searches to the cutover date.
- Splunk sees the new app as a separate install: The version resets (the legacy app ended at 1.3.4, the new app starts at 1.0.0) and the app ID changes to flare_splunk_app, so Splunk treats it as a fresh install rather than an upgrade. If you use a deployment server, add flare_splunk_app to the relevant server classes for your search heads and indexers.
- Changing the index or backfill window re-ingests the whole window: The new app collects only new Events using a checkpoint; changing either setting clears that checkpoint, so the next run re-ingests the entire backfill window. Expect duplicate Events and a temporary spike in license usage, which Splunk counts by daily volume ingested.
- _time means something different in each app: _time is the timestamp an Event is stored under and drives all time ranges and time-based dashboards. The legacy app set it to the ingestion time; the new app uses the Event’s own timestamp from Flare, taking full effect once the legacy app is uninstalled, so the same Event can shift on the timeline after the cutover.
The Flare Dashboard in Splunk
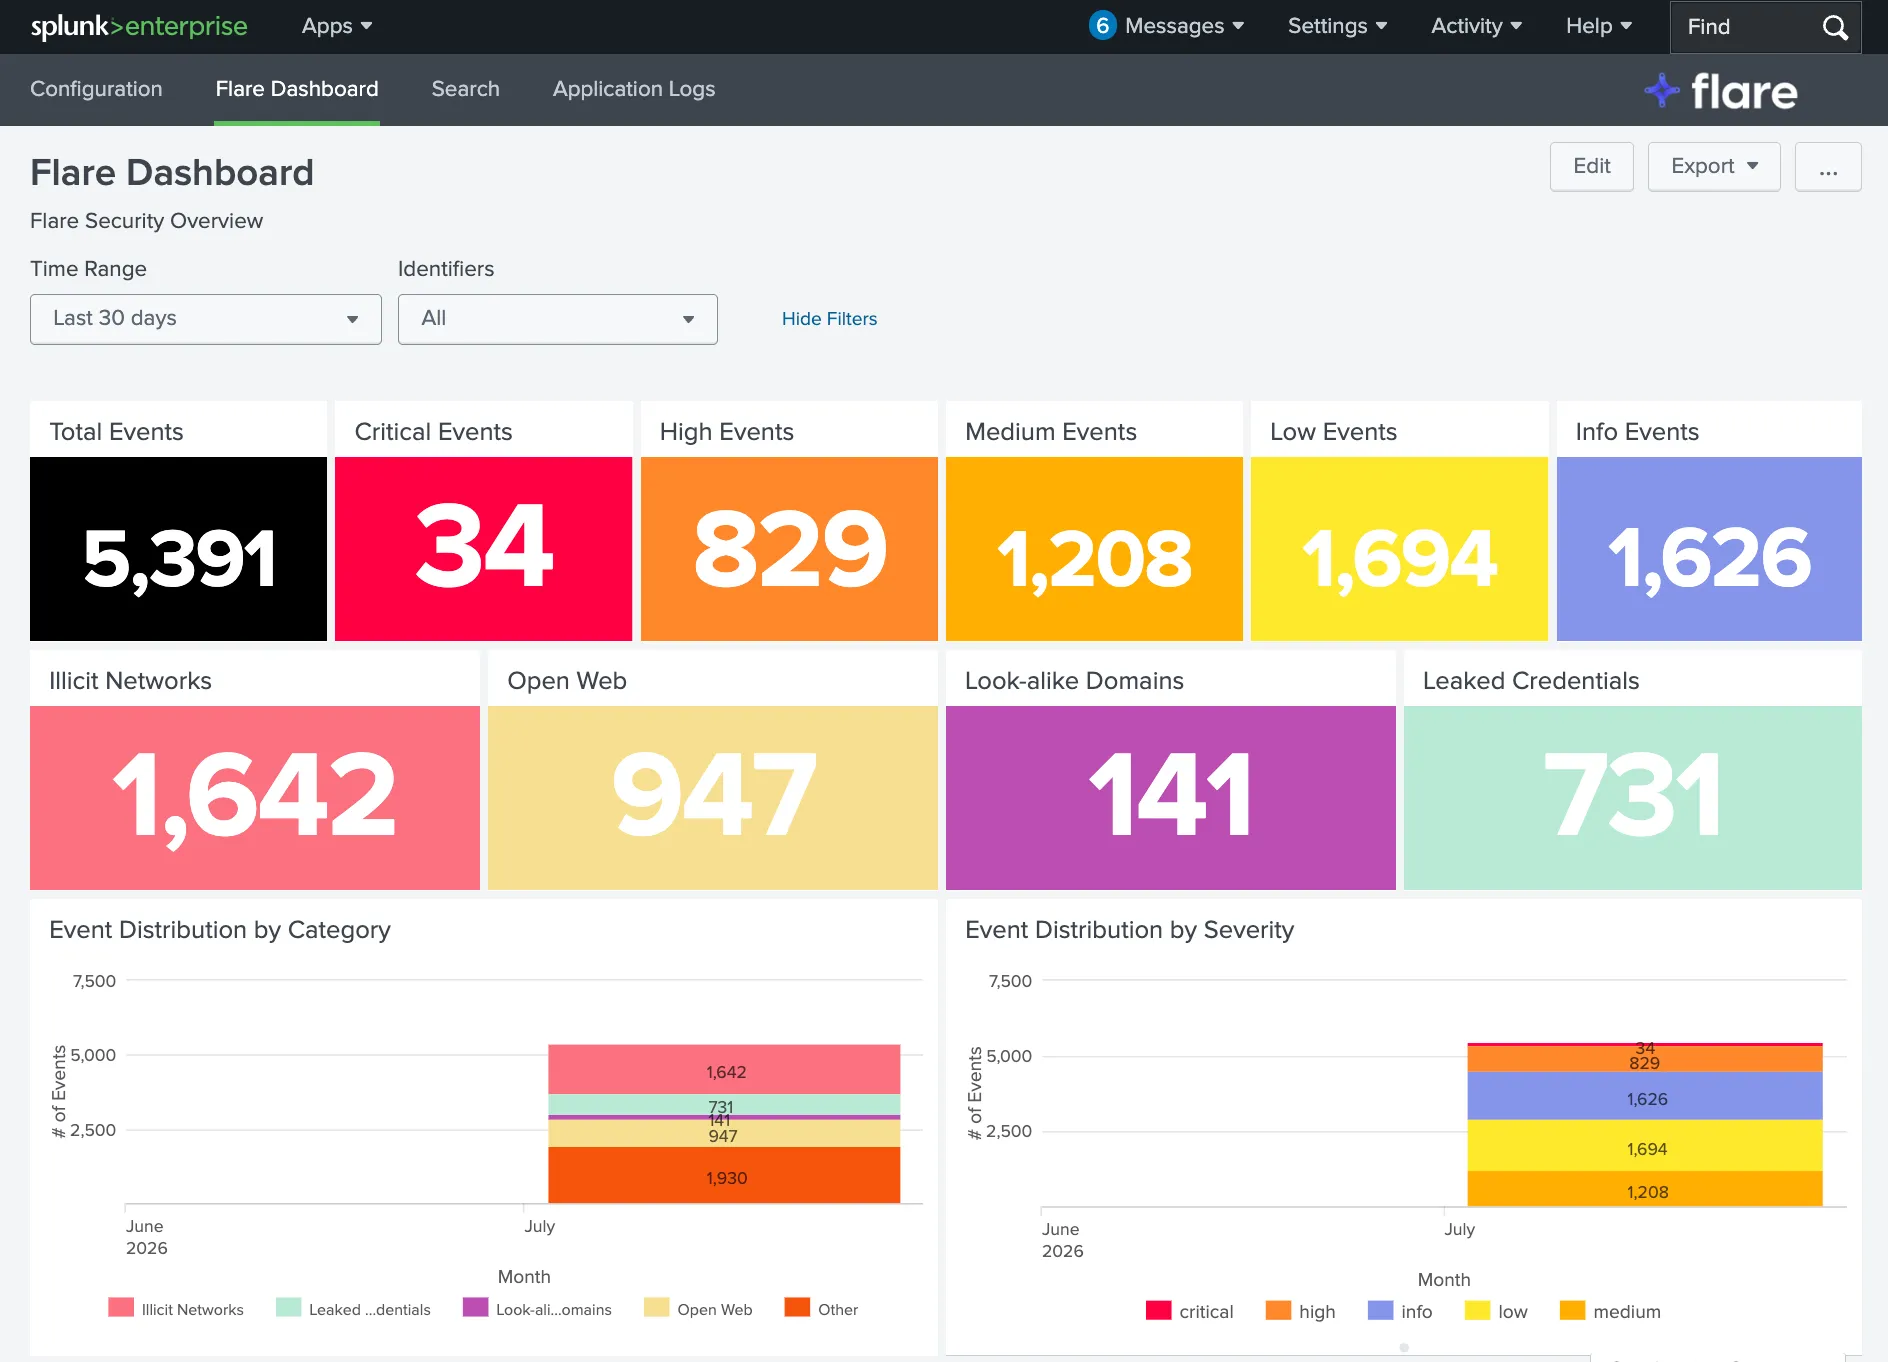
The Flare Dashboard tab in Splunk mirrors the Dashboard in the Flare Platform and gives an overview of the ingested Events.
- Use the Time Range and Identifiers filters at the top to scope what the dashboard shows.
- Use Edit and Export in the top right to customize or export the dashboard.
Search
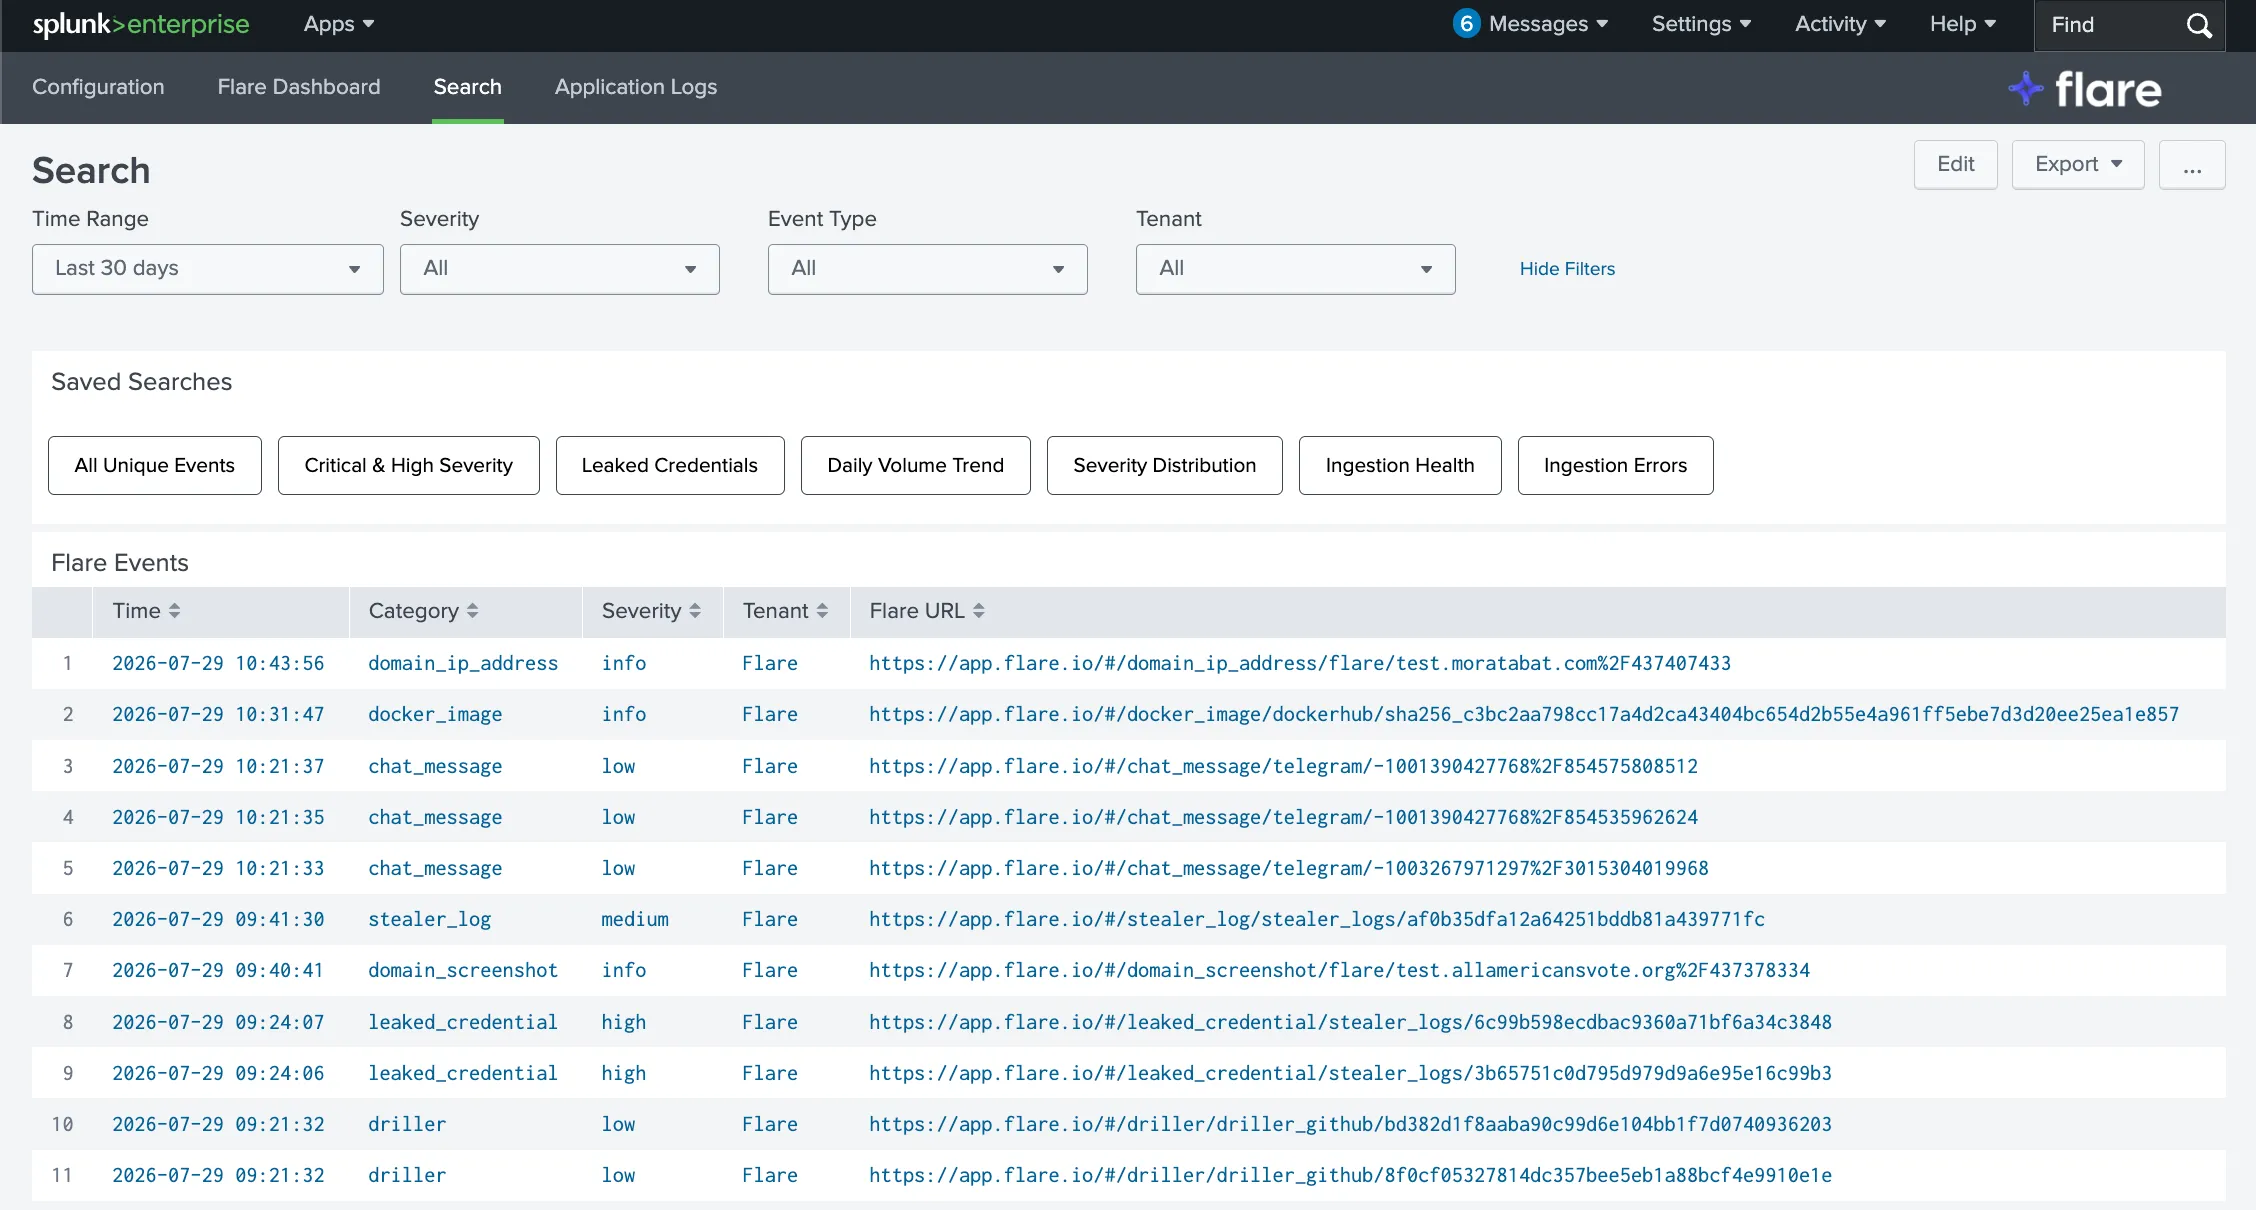
The Search tab lets you explore your ingested Flare Events using the Time Range, Severity, Event Type, and Tenant filters at the top to narrow the results.
- Saved Searches are prebuilt searches for common queries, including All Unique Events, Critical & High Severity, Leaked Credentials, Daily Volume Trend, Severity Distribution, Ingestion Health, and Ingestion Errors.
- The Flare Events table lists the matching Events, with sortable columns for Time, Category, Severity, Tenant, and Flare URL. Each Flare URL links to the Event in the Flare application.
- Use Edit and Export in the top right to customize or export the view.
Application Logs
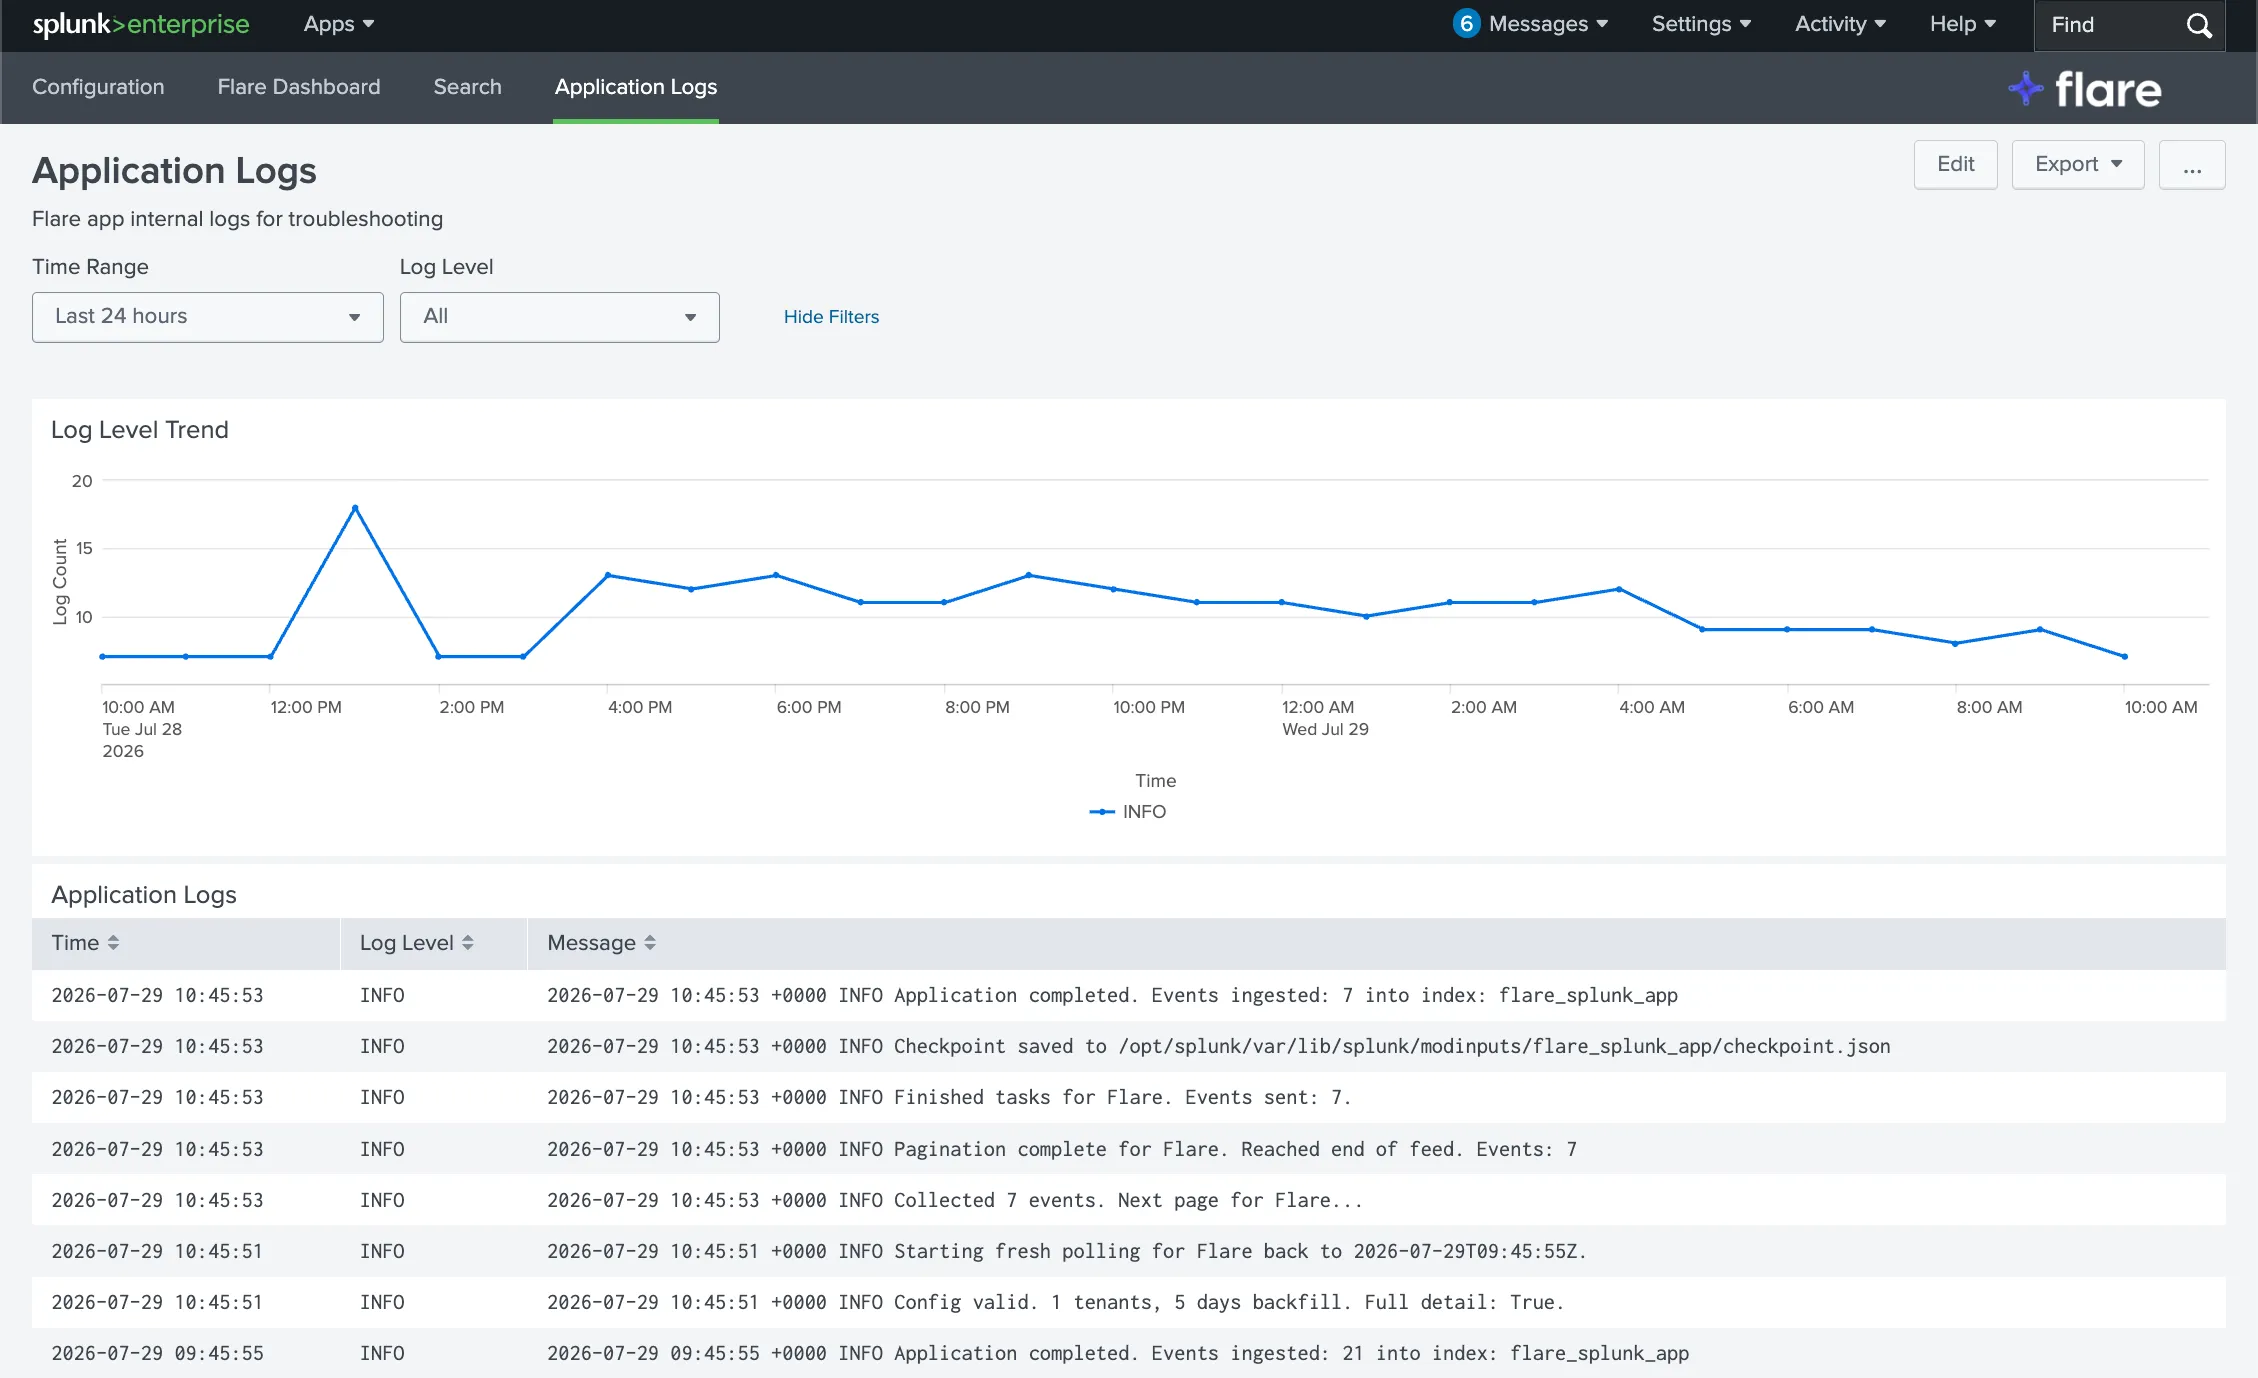
The Application Logs tab shows the app's activity, including when a sync started, whether it succeeded or failed, and any errors tied to a specific activity.