Dashboard
The Flare Dashboard provides metrics and charts that help you understand your organization's exposure based on the data available within Flare, with a focus on actionable metrics that support operational efficiency. Metric cards include inline trend sparklines, so you can see how your Events are trending over the selected date range at a glance.
The Dashboard has two tabs:
- Overview: An operational and strategic view of your exposure, surfacing your most pressing unresolved Events and how they're trending over time.
- Insights: A more detailed breakdown of specific aspects of your exposure, for digging into the areas that matter most once you've reviewed the high-level picture.
Most of the information found in the Overview is also available when creating Reports.
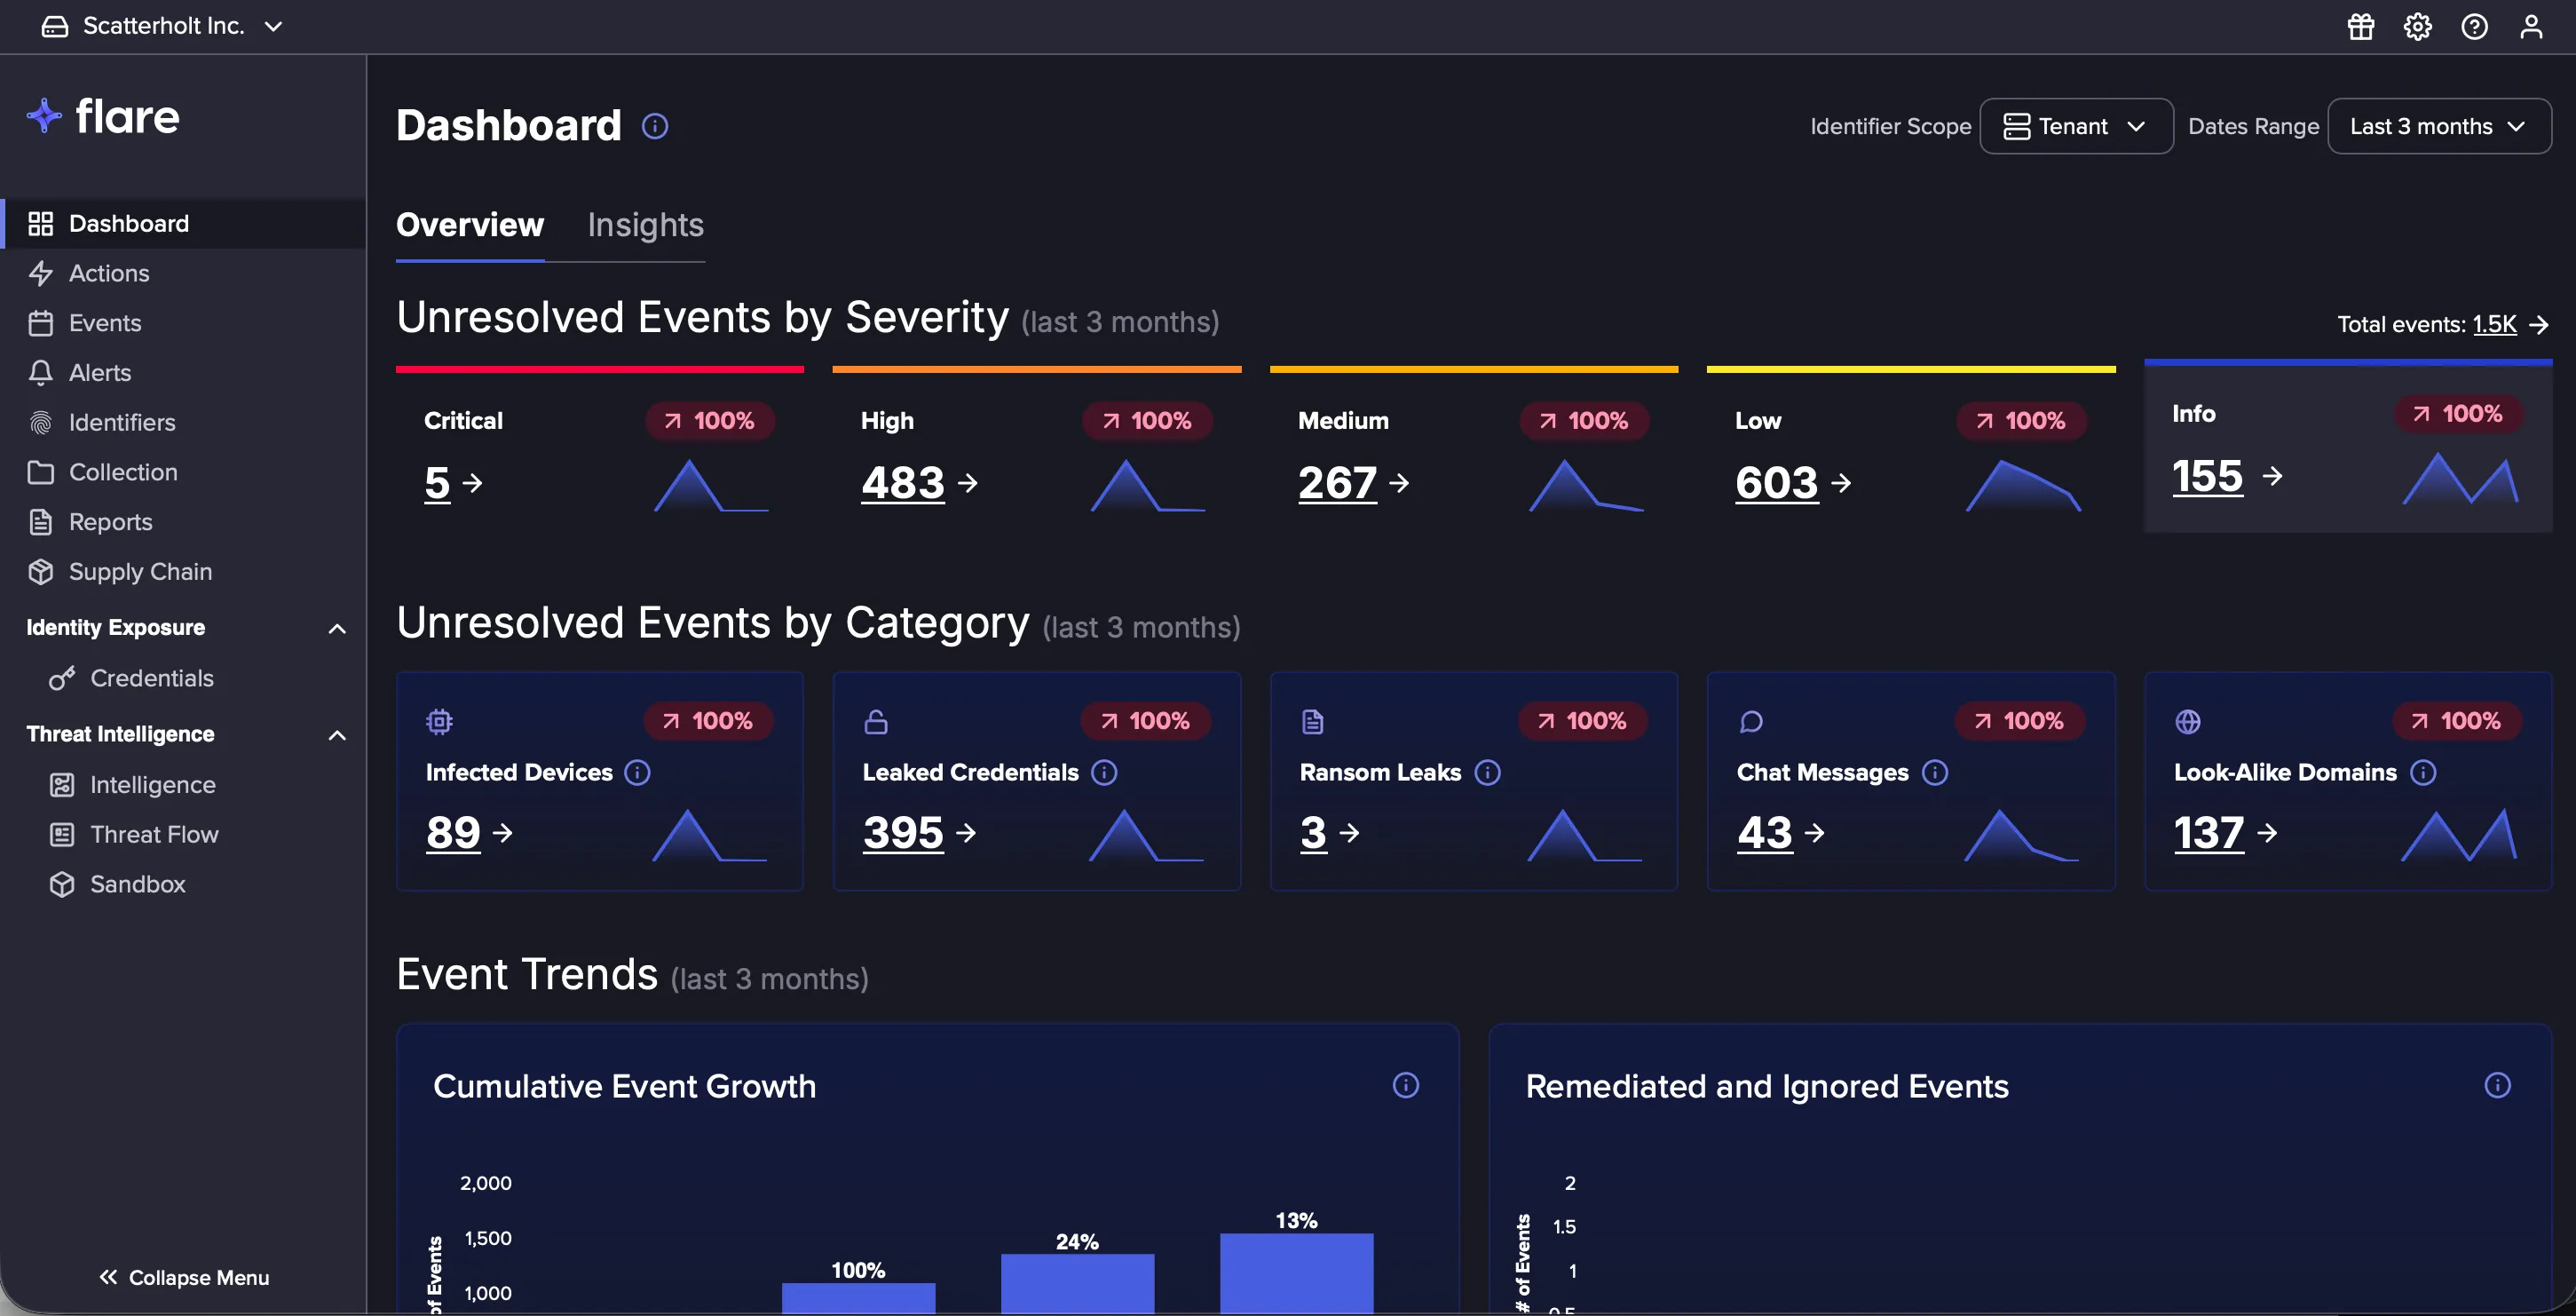
There are four sections to the Overview tab:
- Unresolved Events by Severity and Category: This section caters to frontline security professionals, providing a snapshot of the most pressing events on the attack surface.
- Event Trends: This section helps you understand your exposure growth over time and how your actions in Flare and keeping on top of it.
- Event Explorer: You can filter these charts by category, severity, and timeframe, making them especially valuable to security and executive leadership. They provide insight into long-term trends and how efficiently issues are being resolved.
- Identifier Trends: As businesses grow, their attack surfaces—and identifiers—expand accordingly. This view appeals to both security teams and executive leadership. Additionally, it offers value to MSSP partners by showing how identifiers are being leveraged by end customers.
What Can Explain an Increase in Events?
The following is a list of variables that may contribute to increased events within your Tenant:
- Adding New Identifiers: Creating new identifiers may potentially increase the number of events in Flare, due to the amount of additional identifiers discovered. Learn more how identifiers work at Flare here.
- Non-Optimized Identifiers: Similarly, identifiers that are too broad in scope, or a lack of ignored terms may also increase the number of events. Learn more configuring your identifiers here.
- A Stealer Log Leak: Stealer Logs often have large ripple effects, which have a tendency of creating a large number of corresponding events. Learn more leaked credentials here.
- Critical Events: Similar to Stealer Logs, having at least one critical event will likely drive a large number of events to monitor. Learn more severity scoring here.
- Adding New Data Sources :Additional data sources added to your tenant may result in an increase of events. Learn more about our data sources here.
- Company Growth: Increased visibility may increase the number of threat actors that are targeting you, which in turn can drive an increase of events.
Reach out to your Customer Service representative for additional information on event growth within Flare.
Understanding your Dashboard Data
If the numbers on your Dashboard look different from what you expect, it's usually due to one of the following factors:
Event Counts
The Event Count is counted from the last day within the timeframe you have selected. For example, if you’re looking at monthly data, Flare will count the total number of events that Flare discovered for each month on the last day of that month. If you add or delete identifiers within that same month, this difference will not be taken into account at the monthly level, but may be visible in the weekly or daily charts.
Data Refreshes
Dashboard data is updated daily and is not 'live'. If you perform a change to your events, such as remediation, you will not see the numbers update in the dashboard until the following day. The Event feeds are updated much more frequently, which may result in some minor differences in the data. It also means that if identifiers were created or deleted within the last 24 hours, they will not be taken into account until the following refresh.
Date Filters
The charts are based on the Matched At timestamp for events. This is different from the Estimated Created At timestamp, which is the date by which we sort the events in the Events feed. This means you are likely to see a disparity in the number of events when you are filtering by a certain timeframe on the dashboard, as compared to the events feed. You can learn more about our dates here.
Deletion of Identifiers
Event counts in charts are impacted by the deletion of identifiers. If you’ve exported data from the Dashboard in the past, the numbers may change based on these deletions, which would therefore impact the number of events reported for a given range.