Tenant Portfolio
The Tenant Portfolio in Flare is built for organizations that manage more than one Tenant. It surfaces which Tenants carry the most exposure, so you can focus on the accounts that need attention rather than working through a round of manual checks.
It gives you a single, consolidated view of every Tenant you manage. From one list, you can review Leaked Credentials, Infected Devices, Chat Messages, and Fired Alerts across your entire organization, then drill into any Tenant that needs a closer look.
Key Features
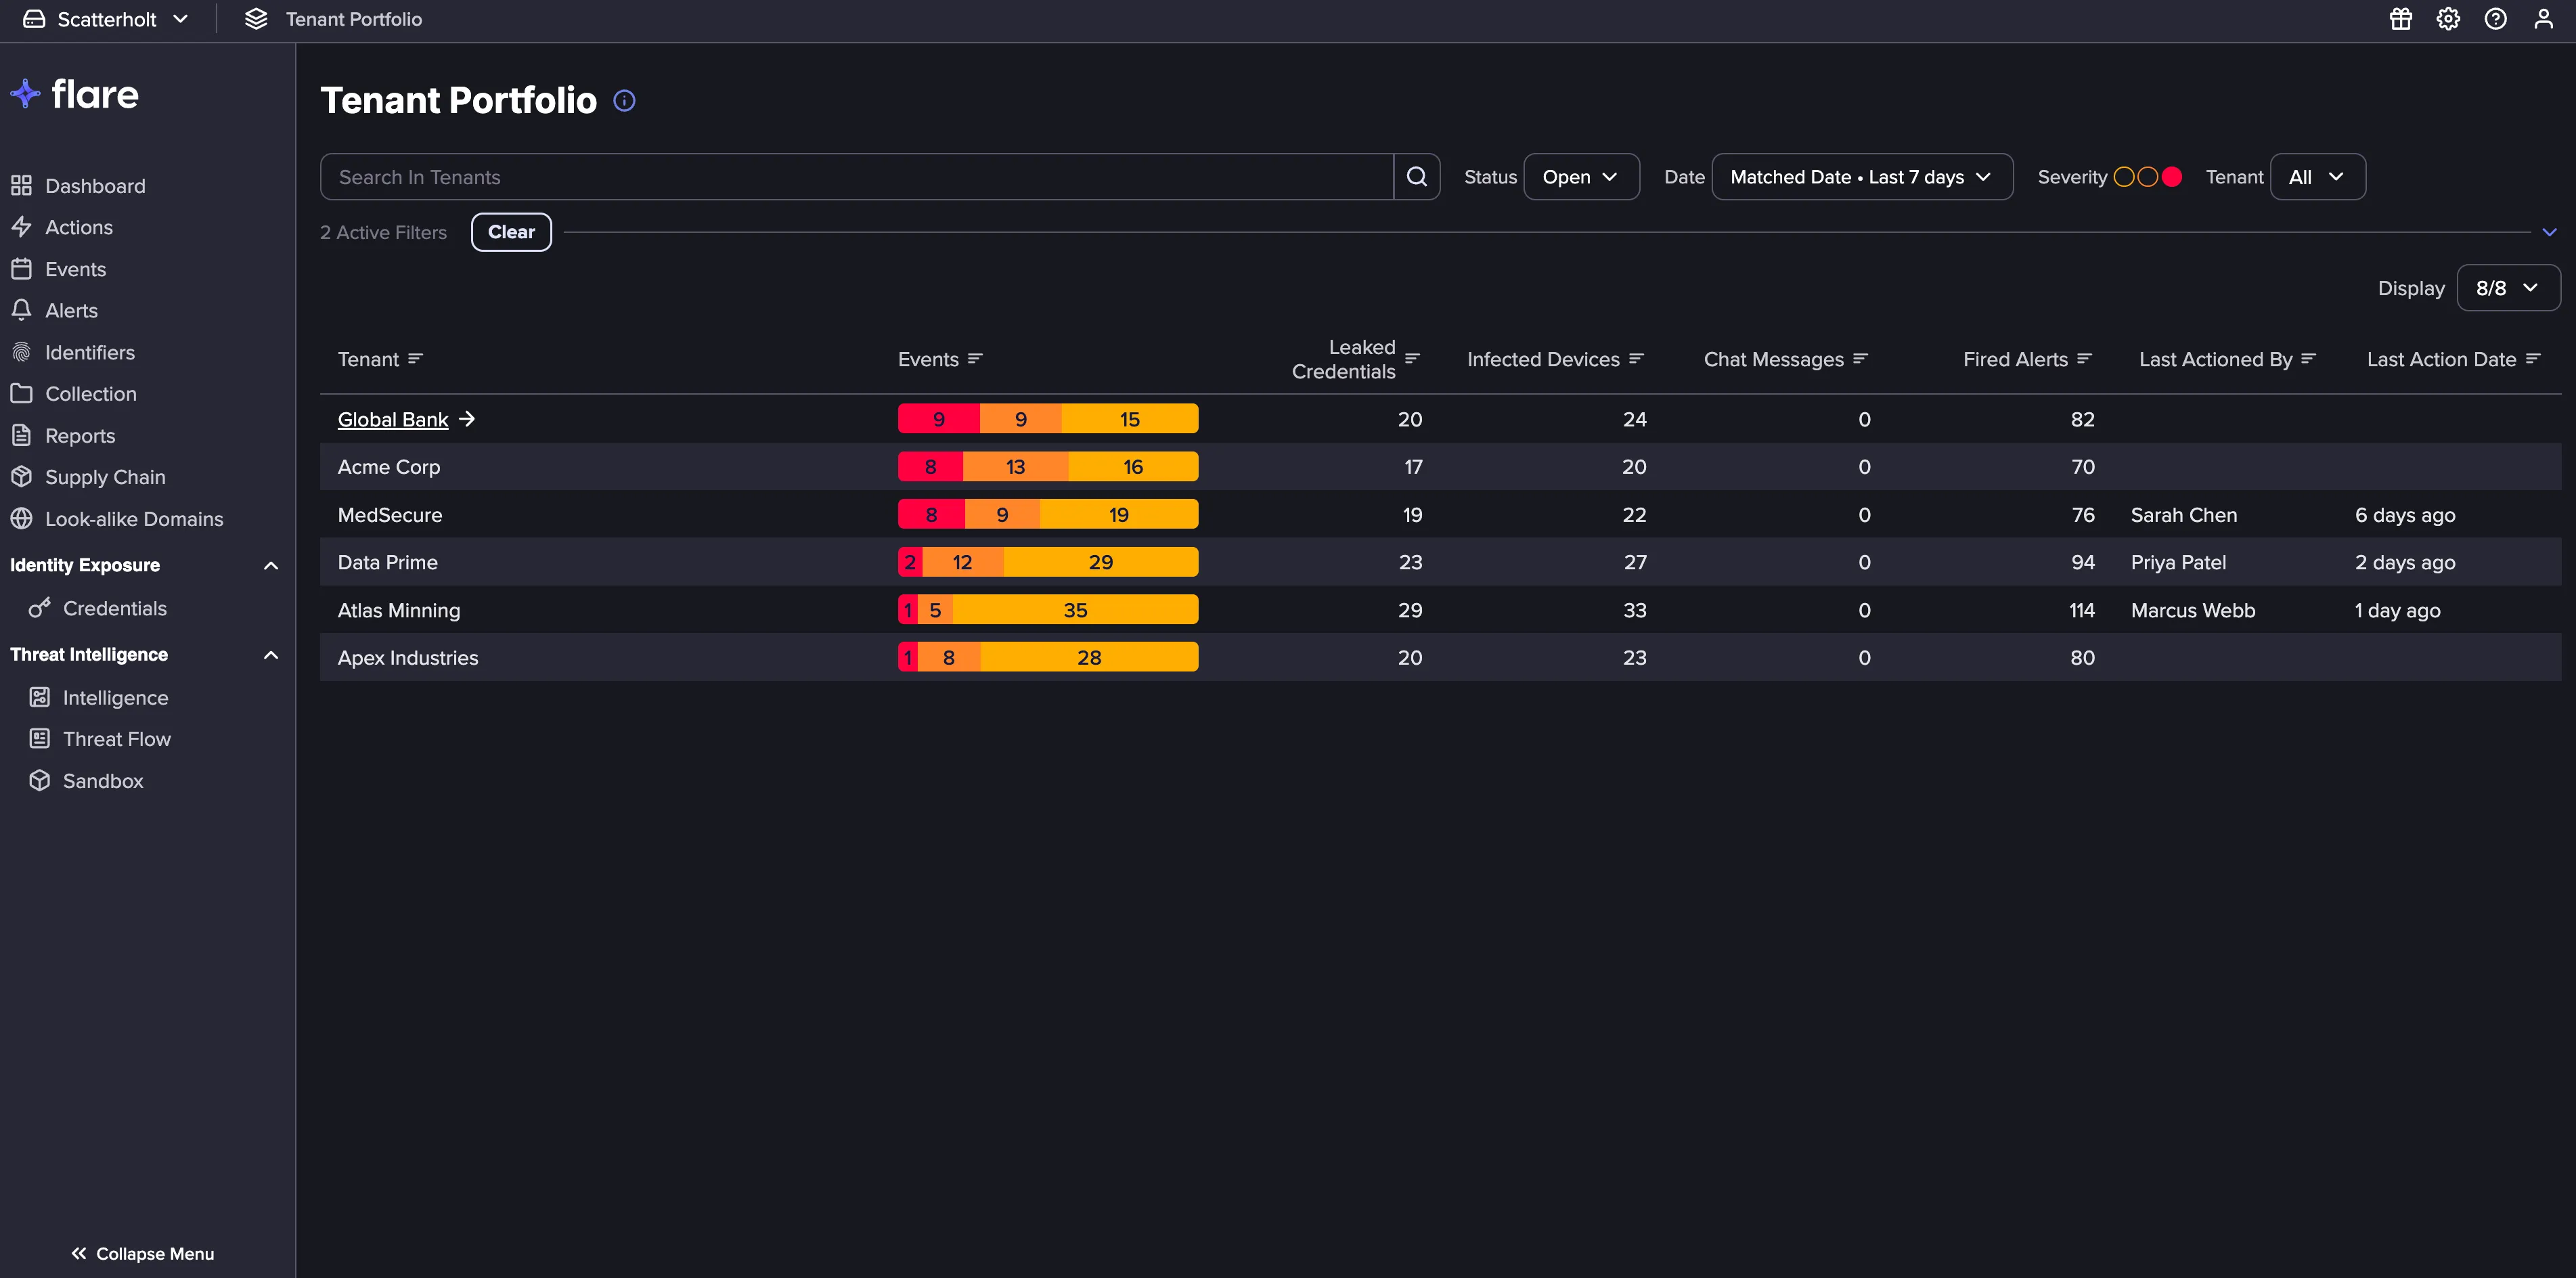
- Consolidated Tenants View: Every Tenant you have access to appears in one paginated view, with key exposure metrics on each row. You can compare Leaked Credentials, Infected Devices, Chat Messages, and Fired Alerts across your whole organization at a glance, and see which Tenants need attention first.
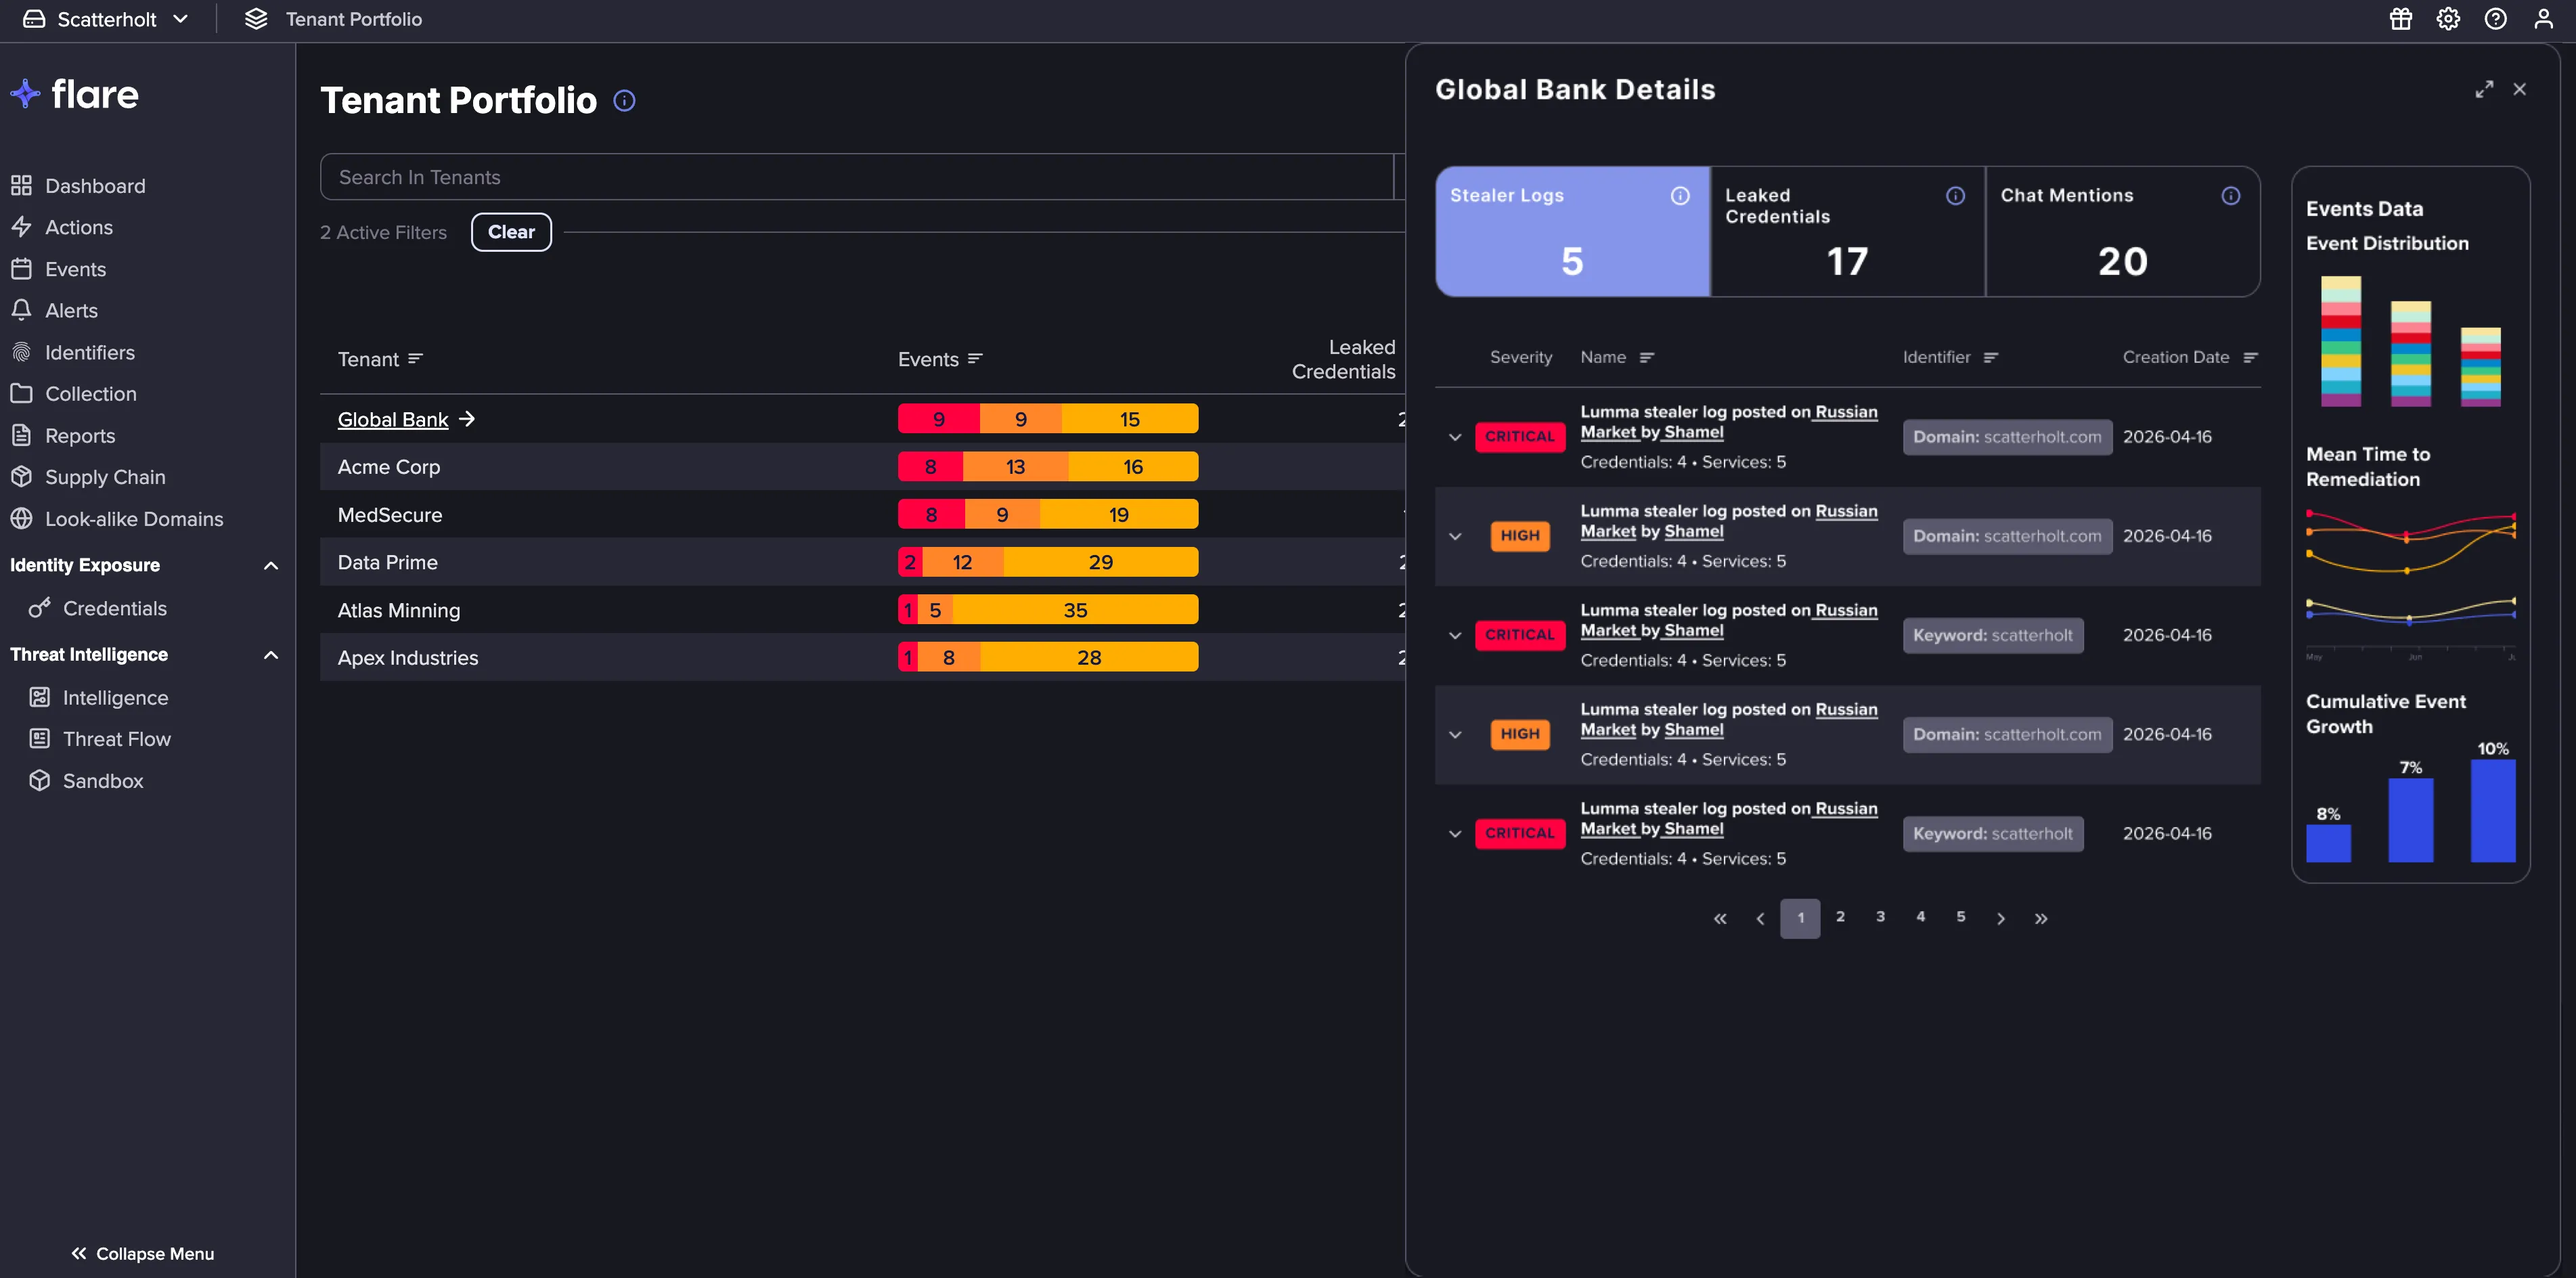
- Tenant Detail View: Select any Tenant to view details with its key metrics, a preview of its most recent Events, and supporting graphs. You can move from one Tenant to the next without losing your place in the list, which makes it quick to work through several accounts in a row.
- Assigned Tenants: Organization Admins can switch between viewing every Tenant in the organization or only the Tenants assigned to them. Members can view only the Tenants assigned to them.
- Search and Filtering: Filter the Tenant list to a specific Tenant, a severity level, or a time window, so the metrics and Events you see always reflect the period you selected.
Using the Tenant Portfolio
Follow these steps to view the Tenant Portfolio:
Click the Tenant Portfolio option from the top navigation bar to view a listing of every Tenant you have access to.
If you are an Organization Admin, you will see all Tenants in the organization by default. Use the Tenant setting to view just the Tenants assigned to you.
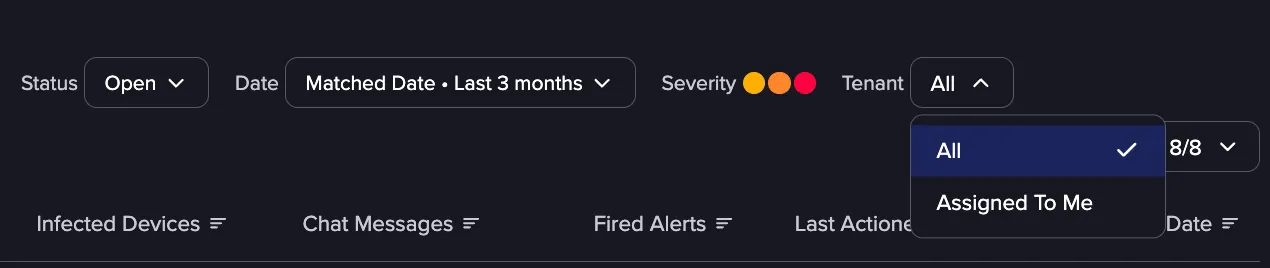
If you are a Member, you will see only the Tenants assigned to you.
Each row in the Tenant Portfolio represents one Tenant and surfaces its key exposure metrics, so you can compare accounts at a glance:
- Tenant: This displays the Tenant's name. Click on a name to view the Tenants Events Feed. Only users assigned to a Tenant can view its feed.
- Events: A distribution of the Tenant's recent Events that have Medium, High, or Critical severity.
- Leaked Credentials: The number of exposed credentials found for that Tenant.
- Infected Devices: The number of infected devices found for that Tenant.
- Chat Messages: The number of chat messages found for that Tenant.
- Fired Alerts: The number of Alerts sent for that Tenant.
- Last Actioned By: The user who last remediated or ignored an Event for that Tenant.
- Last Action Date: The date of that last remediate or ignore action.
If you manage multiple Tenants, you can use the Tenant Portfolio to see which accounts picked up new Leaked Credentials or Infected Devices overnight. A Tenant with a sharp increase stands out immediately, and you can open it to investigate further.
Viewing Tenant Details
Click on a Tenant to view the following additional information:
- Key metrics: The number of Leaked Credentials, Infected Devices, and Chat Messages. Click on these metrics to view Events related to them.
- Events preview: A list of Events relevant to the selected metric. Click on an Event to view its details.
- Graphs: Event Distribution, Mean Time to Remediation, and Cumulative Event Growth for the Tenant.
Tenant Portfolio provides a read-only status of your Tenant. To remediate or ignore an Event, open the Tenant and work from its full Events feed.
Searching and Filtering
The Tenant Portfolio includes a search bar for quickly finding a specific Tenant.

The Tenant list can also be filtered on the following fields:
- Status: Filter for Open, Ignored, or Remediated Events.
- Date: A timeline for the Events, with the option to filter by Creation Date or Matched Date. Use the date filter to scope the metrics shown in the list, and the Events shown in the Tenant details, to a specific period. This is useful when you are preparing a client report and want to see only the activity from a given month.
- Severity: Filter based on Medium, High, and Critical severities.
Click Clear to remove any applied filters and return to the full list.